Figure 2.
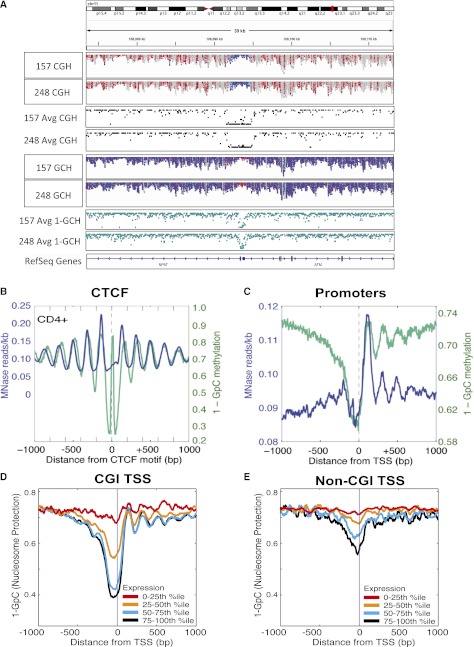
NOMe-seq diplays nucleosome occupancy profiles at specific loci and globally. (A) Broad view of the ATM promoter using a newly developed module of the IGV viewer (Thorvaldsdottir et al. 2012) to visualize NOMe-seq BAM alignment files. The top two tracks indicate endogenous DNA methylation (at HCG sites) in each of two GBM samples, while tracks 5 and 6 indicate GCH accessibility of the same GBM samples. (Red) Methylated sites (for both HCG and GCH); (blue) unmethylated sites (for both HCG and GCH). The promoters of ATM and NFAT are unmethylated (blue in top two tracks) and nucleosome-depleted (i.e., accessible and therefore methylated, and thus red in tracks 5 and 6). The same methylation and nucleosome occupancy pattern is seen for both GBM samples. Tracks 3 and 4 show average methylation levels derived from these tracks—at each individual HCG, the number of reads methylated at that HCG is divided by the total number of reads methylated and unmethylated. Average GCH methylation in tracks 7 and 8 is calculated as before but inverted (1-GCH) to indicate nucleosome protection as used throughout the main figures. The tool and source code are publicly available for download at the IGV project website: http://www.broadinstitute.org/igv/. (B,C) NOMe-seq reads were aligned to CTCF (B) and TSSs (C). Nucleosome positioning in IMR90 cells is indicated on the y-axis by inaccessibility to M.CviPI (1-GpC methylation; teal line) and the number of MNase sequencing reads (blue line). For MNase-seq, reads were aligned to 8709 CTCF sites, while 8687 CTCF sites had at least one GpC site that was covered by a minimum of three reads (B). For TSS, 42,103 promoters were used for MNase-seq, and 41,292 promoters had at least one GpC site that was covered by a minimum of three reads. (D,E) Gene promoters were divided into quartiles based on transcription level (Hawkins et al. 2010), and the corresponding M.CviPI inaccessibility (1-GCH, teal line) is plotted on the y-axis. (D) CpG island promoters. (E) Non-CpG island promoters. The NDR is stronger in more highly expressed genes and, in some cases, can be several hundred bp long to accommodate multiple nucleosomes.

