Figure 4.
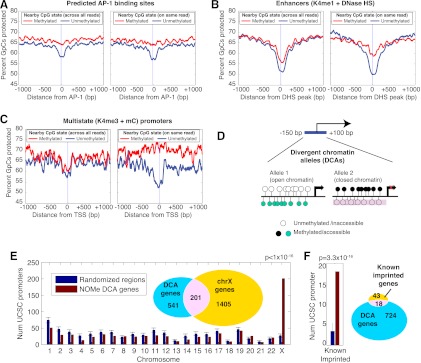
Combinatorial epigenomic signatures reveal functional chromatin. (A–C) Nucleosome occupancy levels (“percent of GpCs protected”) are shown stratified by the methylation status of nearby CpGs (within 20 bp). For each element type, this analysis was performed twice—once sampling randomly across all reads covering the same genomic position as the GpC (left plots, labeled “across all reads”) and a second time using only the methylation status from the same read (right plots, labeled “on same read”) (see Methods). All three examples show nucleosome depletion associated primarily with the unmethylated state, but while predicted AP-1 binding motifs (A) display this in both population and within-read profiles, enhancers and promoters marked by the opposing K4me3 and meC (B,C) show this association only in the within-read analysis. 0 refers to the center of the AP-1 binding motif (A), the peak of DNase HS within K4me1-marked regions (B) and TSSs (C). (D) Search strategy for finding divergent chromatin alleles (DCA) by searching TSS regions for at least two reads with opposing chromatin profiles in IMR90 cells. (E) Promoters that exist in both nucleosome-depleted and unmethylated and nucleosome-occupied and methylated are enriched on the X chromosome. Seven hundred and forty-two DCA genes were compared to randomized sets of 742 genes—1000 trials were performed and the standard deviation is shown for the number on each chromosome. A P-value was determined from the X chromosome using a binomial test with the probability determined by the random trials. (F) DCA genes were compared to 1000 randomized gene sets for the number within 50 kb of known imprinted genes.

