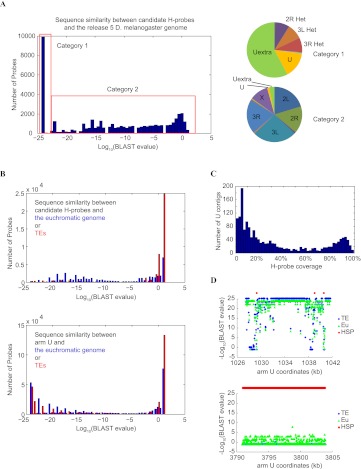
Figure 1.
Sequence analysis of candidate H-probes. (A) Distribution of candidate H-probes according to their sequence similarity to the reference genome shown here as BLAST e-values. The pie diagrams on the right show the distribution of the best BLAST hit for each category. H-probes in category 1 map to heterochromatic sequences, whereas most H-probes in category 2 have their best matches evenly distributed to euchromatic regions. (B) Comparison of H-probes with chromosome U sequences. 60mer pseudo probes were generated spanning the entire arm U with a 30-nt overlap. Their best alignments on the assembled euchromatin (including “h”) or annotated TEs were assessed. Our H-probes show low similarity to euchromatic sequences in the reference genome (blue) or to TEs (red), whereas a significant fraction of the pseudo arm U probes show such homology. (C) Distribution of arm U contigs according to the percentage of the contig sequence that is covered by H-probes. (D) Two examples showing the typical patterns of H-probe location relative to the euchromatin-like and TE-like sequences in arm U contigs. Some U contigs are predominantly composed of sequences that are highly similar to the euchromatin and therefore only contain a small number of H-probes (top), whereas others show little sequence similarity to the euchromatin and are populated by H-probes (bottom).

