Figure 6.
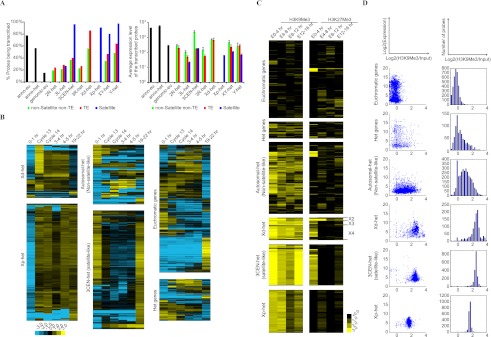
Transcription profile of the heterochromatic sequences. cDNA were prepared from manually staged wild-type Oregon R embryos at various developmental stages and analyzed by microarray using cDNA prepared from Oregon R embryos with mixed developmental stages (0–16 h) as reference for hybridization. The hybridization intensities of the test cDNAs were normalized according to the reference cDNA and used as a measure of transcription levels. The cutoff for background (nonspecific) hybridization intensity was determined using control probes that do not hybridize with Drosophila sequences. (A, left) Percentage of H-probes that are transcribed during the examined stages. (Right) The average transcription level of the H-probes that are transcribed. Annotated euchromatic genes (anno-eu), annotated heterochromatic genes (anno-het), and genomic euchromatic sequences (genomic-eu) were included as controls. (B) Temporal pattern of expression shown as fold changes compared to the reference. H-probes from each chromosomal region were grouped by hierarchical clustering according to their expression profiles (left and middle). Only transcribed probes are shown. Prevalent temporal patterns were detected for H-probes mapped to Xd-het and Xp-het and the satellite-like H-probes mapped to 3CEN-het, but not the non-satellite-like H-probes mapped to autosomal heterochromatin. Annotated heterochromatic genes (Het genes) and 2000 randomly selected euchromatic genes were clustered and shown as controls (right). (C) Histone modifications associated with H-probes. ChIP-seq reads for H3K9Me3 and H3K27Me3 (modENCODE) were aligned to H-probes and the number of reads for each H-probe was normalized to the input. Heat map demonstrates enrichment of each modification by showing log2(normalized reads). H-probes within the same category were clustered by hierarchical clustering. Note that H-probes mapped to the same subdivision (X2, X3, or X4) of Xd-het share similar patterns of H3K27Me3 enrichment. Annotated euchromatic and heterochromatic genes (Het genes) were included as controls. (D, left) Bivariate scatter plots comparing H3K9Me3 enrichment with level of transcription during early embryogenesis. The x-axis is the average of log2(normalized reads for H3K9Me3) at 0–4 h, 4–8 h, and 8–12 h of the embryonic development. The y-axis is the log2 scale of the highest transcription level during 2.5–5 h of the embryonic development detected by microarray. (Right) Distribution of the H-probes according to their enrichment for H3K9Me3 during 0–12 h.

