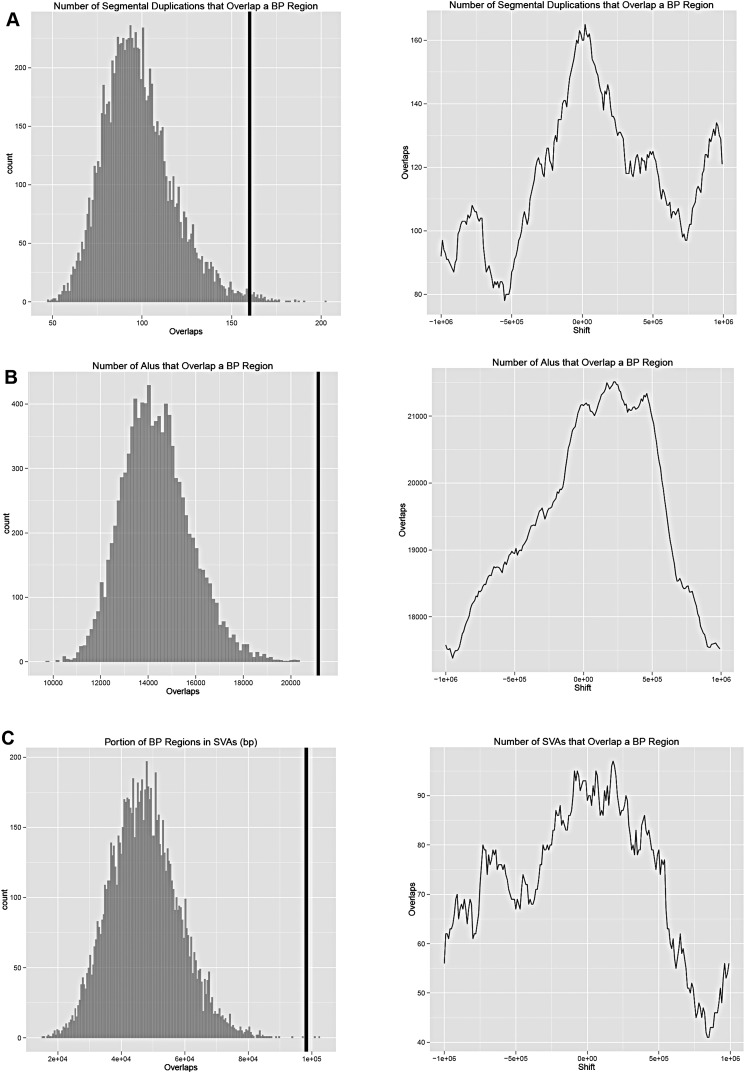
Figure 4.
Enrichment of genomic features in breakpoint regions. Permutation tests were used to assess the overlap between the gibbon breakpoints and genomic features. (A) Segmental duplications; (B) Alu elements; and (C) SVA elements. The black vertical line indicates the observed value for the breakpoints identified in the study. In all three cases it is evident that the genomic features have a higher overlap with the breakpoints than one could expect by chance.

