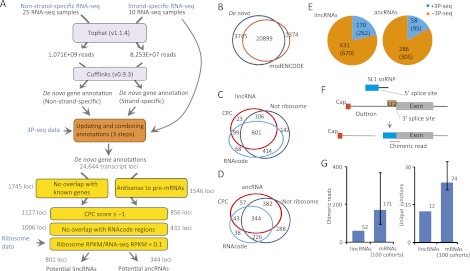
Figure 1.
Identification of C. elegans lncRNA genes. (A) Pipeline for de novo gene annotation and identification of lncRNAs. See main text and Supplemental Methods for details. (B) Venn diagram showing the overlap between the results of de novo gene annotation and modENCODE gene annotation. (C) Venn diagram showing the overlap of candidate lincRNA loci that passed the indicated filters. (D) Venn diagram showing the overlap of candidate ancRNA loci that passed the indicated filters. (E) The fraction of potential lncRNAs that had 3P-seq supported poly(A)-sites. Shown are the numbers of genes, with the number of splicing/3′ UTR isoforms in parentheses. (F) Diagram of trans-splicing by splice leader 1 (SL1). A chimeric read spanning the SL1-exon junction is diagnostic of trans-splicing. (G) Number of chimeric reads and unique junctions mapping to the upstream regions of lincRNA and protein-coding genes. For protein-coding genes, 100 cohorts, each selected to match the set of lincRNA genes with respect to gene number and expression levels, were used to estimate the 90% confidence interval (error bar).

