Figure 5.
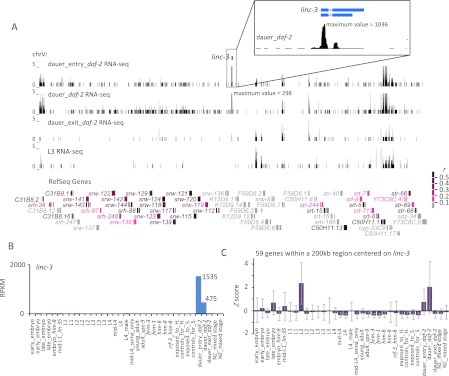
Long-range expression correlations involving the dauer-specific linc-3. (A) Expression of genes located within a 200-kb region centered on linc-3. The RNA-seq tracks illustrate that linc-3 and many other genes in the region were expressed higher in dauer entry and dauer stages compared with dauer exit and L3 stages. (Inset) Gene structure of linc-3 and its very high expression during dauer entry, with a read maximum exceeding that of any other gene in the region. The gene models are color-coded based on the correlation between their expression and that of linc-3 (key). (B) The expression profile of linc-3 across 35 different developmental stages/conditions. (C) The expression profile of the 59 genes within 200 kb of the linc-3 gene, visualized by plotting the mean z scores for each stage/condition. The error bars indicate standard deviation.

