Fig. 2.

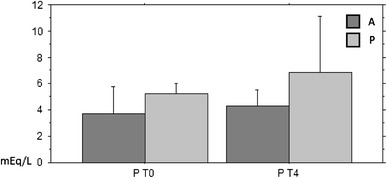
Phosphatemia in the blood-before (T0) and after 4 months of (T4) treatment AFC (A) vs. placebo (P): it can be observed that the increase in the concentration of serum phosphorus is lower in group A compared to group P and T4 P < 0.005

Phosphatemia in the blood-before (T0) and after 4 months of (T4) treatment AFC (A) vs. placebo (P): it can be observed that the increase in the concentration of serum phosphorus is lower in group A compared to group P and T4 P < 0.005