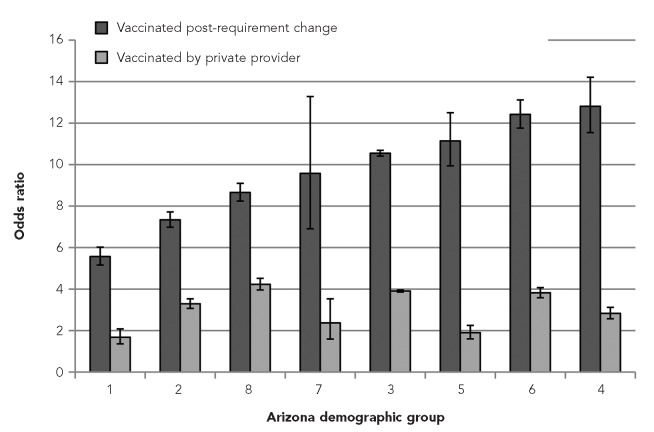
Figure 2.
Logistic regression model ORsa for meningococcal vaccination of children by end of age 12 years, by Arizona demographic groups based on household, income, education, and racial profiles
aThis figure illustrates the relationship between the lower ORs in demographic groups 1, 2, and 8 as opposed to ORs in the other demographic groups. These three groups represent the demographic groups with overall highest poverty rates, more children per family, lowest educational attainment, and highest proportion of Native Americans with fewer white people. The ORs are for either the odds of an on-schedule (by end of age 12 years) meningococcal vaccination following the Arizona statewide rule change in 2008 requiring vaccination (dark gray bars), or the odds of an on-schedule vaccination (by end of age 12 years) given by a private provider vs. a public provider (light gray bars).
OR = odds ratio

