Figure 2.
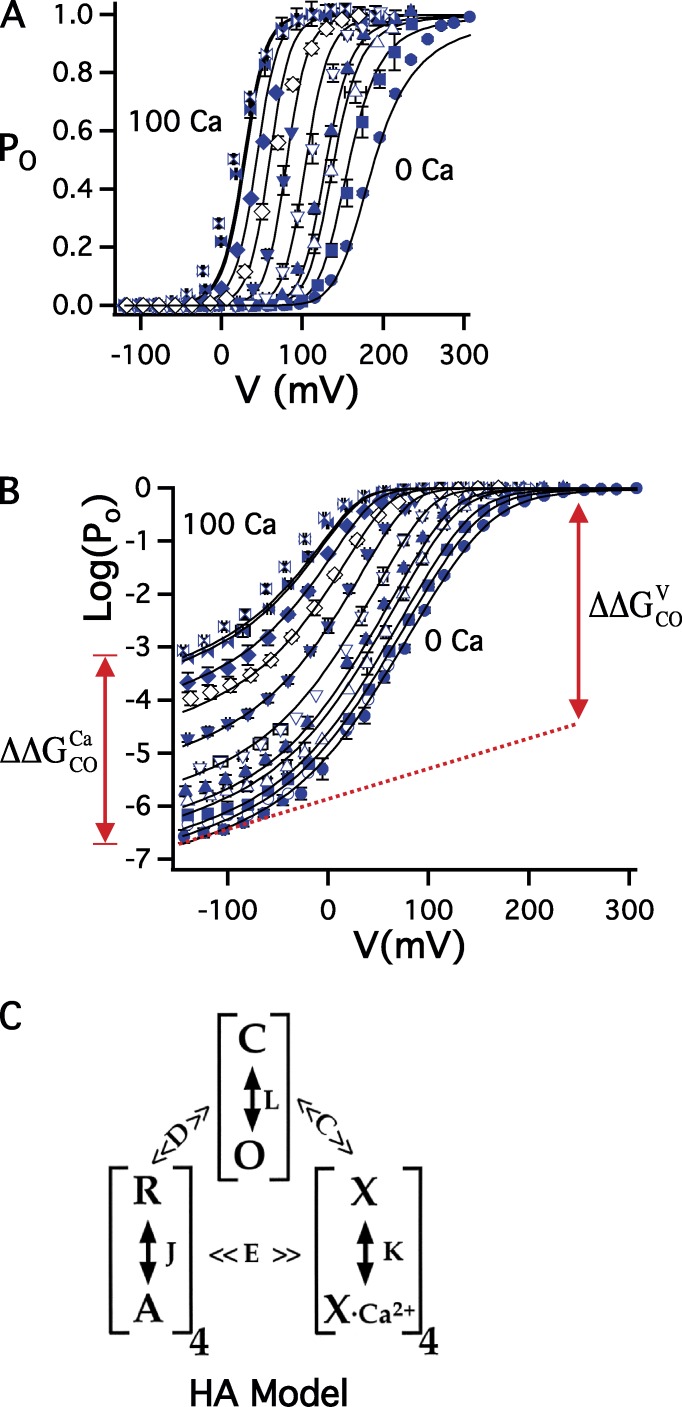
Voltage- and Ca2+-gating of BK channels. (A) PO-V relations for mSlo1 estimated as GK/GKmax from macroscopic tail currents after 30 ms voltage pulses in 0–100 µM Ca2+. (B) Log(Po)-V relations extend PO to <10−2 using steady-state unitary current recordings from macropatches. A and B represent mean ± SEM and are fit (solid curves) by the HA model (Horrigan and Aldrich, 2002). The increase in Log(Po) from 0 Ca2+ to saturating 100 µM Ca2+ at −120 mV (where voltage-sensors are in the resting state) reflects Ca2+-sensor/gate coupling energy (). The increase in Log(Po) in 0 Ca2+ from −120 mV to ∼+300 mV (where voltage sensors are fully activated) reflects voltage-sensor/gate coupling (). The values of and are determined from the change in the free energy of the gate (e.g., , where ), and, in the case of , the measurement at −120 mV must be extrapolated to positive voltages (dashed line) to correct for the weak voltage dependence of the C-O transition (zL = 0.3 e). (C) Allosteric model indicates the possible conformations of the gate (C and O), voltage sensors (R and A), and Ca2+ sensors (X and X-Ca2+) in each of four subunits and allosteric factors (C, D, and E) that describe the energetic coupling between these three parts of the channel. J and L are voltage-dependent equilibrium constants with zero-voltage values J0 and L0 and partial charges (zJ, zL), K = [Ca2+]/KD, where KD is the elementary Ca2+ dissociation constant for the closed channel.

