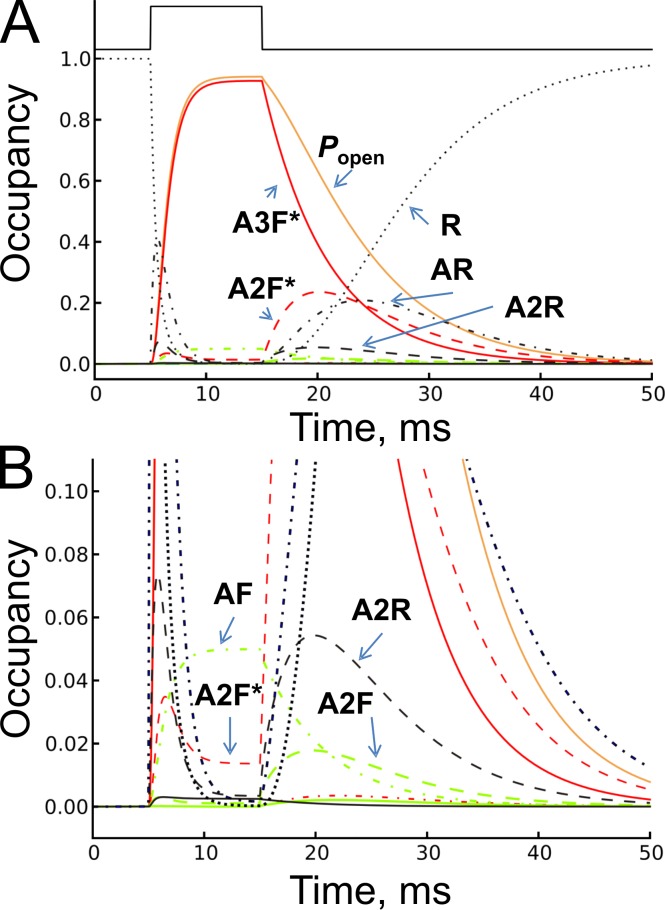
Figure 6.
The time course of occupancies. The time course of glycine receptor state occupancies is shown over the full range, 0–1 in A, and as an enlarged view of occupancies below 0.1 in B. The occupancies were calculated from Eq. 1 and plotted for all 10 states in the flip mechanism (Fig. 3) after a step in glycine concentration from 0 to 1 mM, and, 10 ms later, a step from 1 mM to zero (the concentration profile is shown on top of panel A as black solid line). Occupancies of the resting conformation are plotted in black, flipped conformation is plotted in green, and open conformation is plotted in red. Solid lines represent triliganded states, dashed lines those of diliganded states, and dashed-dot lines show monoliganded states. Occupancy of the unliganded resting state R (state 10) is plotted as a dotted black line and the total open probability as a solid orange line.

