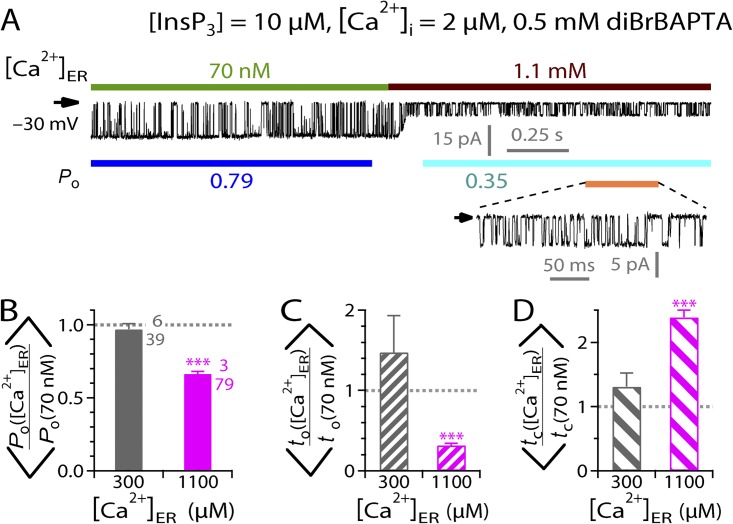
Figure 3.
Modulation of InsP3R channel activity by various [Ca2+]ER in saturating [InsP3]. (A) A typical single-channel current trace recorded during a switch of [Ca2+]ER from 70 nM to 1.1 mM. Note the substantially smaller channel current when [Ca2+]ER = 1.1 mM as a result of the blocking of the channel by permeant Ca2+. A part of the current trace (indicated by an orange line) is shown with larger current and time scales in the inset to show the details of channel gating in [Ca2+]ER = 1.1 mM. (B–D) Bar graphs of mean ratios of channel Po, to, and tc observed before and after [Ca2+]ER switches between 70 nM and 300 µM or 1.1 mM, as indicated.

