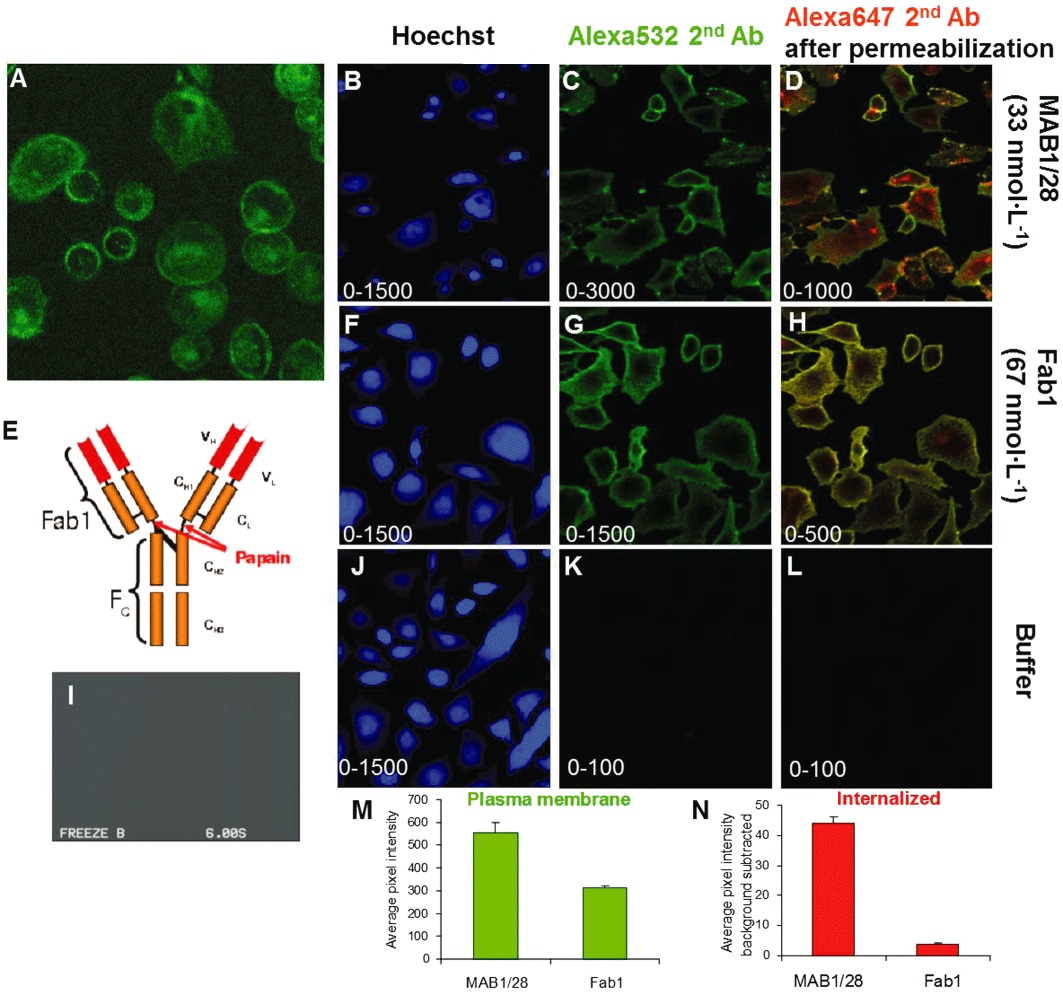
Figure 6.

Comparison of MAB1/28 and Fab1 fragments induced mGlu7 internalization. Direct immunofluorescence on live CHO-DUKX-CRE-luci-rmGlu7a stable cell line 83 (A) and non-transfected CHO-DUKX-CRE-luci control cells (I) by MAB1/28-Alexa488. E, tertiary protein structure of 1/28 type of antibody. Indicated is the papain enzyme cleavage site used for generation of monovalent Fab1 fragments. Images of CHO mGlu7 expressing cells which have been incubated with 33 nmol·L−1 MAB1/28 as primary antibody (B–D), 67 nmol·L−1 Fab1 fragments (F–H) or with no primary antibody or Fab1 fragments (J–K) at 37°C before being washed and transferred to ice for secondary staining and fixation as described in the protocol. Each row contains images acquired in parallel of the same field of view in the well. (B, F and J) Images acquired with filter settings selective for TrueBlue and Hoechst 33258 stain (laser 405 nm, emission reflected by long path 650 filter, filtered through short path 568 filter and band path 455/70 filter). (C, G and K) Images acquired with filter settings selective for the cell surface stain with Alexa532 secondary antibody (laser 532 nm, emission reflected by LP650 and filtered through LP568 and BP586/40). (D, H and L) Images acquired with filter settings selective for the whole cell stain with Alexa647 secondary antibody after membrane permeabilization (laser 635 nm, emission passing through LP650 and filtered through BP690/50). The range of the pixel intensity grey scale ranging from black to white is indicated in lower left corner of the individual images. (M, N) The quantified surface staining and cytoplasmic spot intensity for, respectively, MAB1/28 and Fab1 fragments. Average pixel intensity in cell surface stain (M) and pixel intensity in cytoplasmic spots per cytoplasmic area (N).
