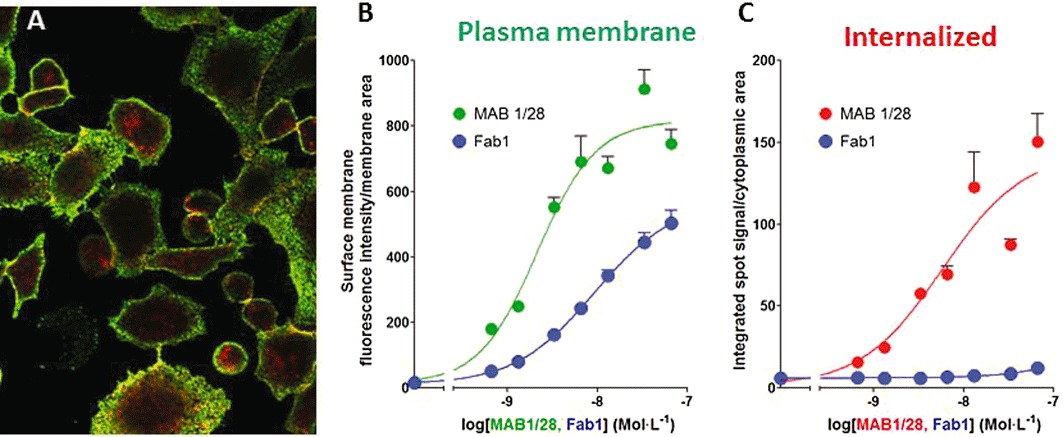
Figure 7.

Image-based analysis of MAB1/28 internalization. (A) Cell surface (green; Alexa532, secondary antibody) and intracellular (red; Alexa647, secondary antibody after permeabilization) staining by MAB1/28 in the CHO mGlu7 expressing cells. (B and C) Dose–response curves with different concentrations of MAB1/28 and Fab1 for plasma membrane staining and receptor-induced internalization. Average pixel intensity in cell surface stain (B) and pixel intensity in cytoplasmic spots per cytoplasmic area (C) are indicated. Each point is the average of three wells, shown as the mean ± SD. The graph is a representative of two independent experiments.
