
Figure 1.
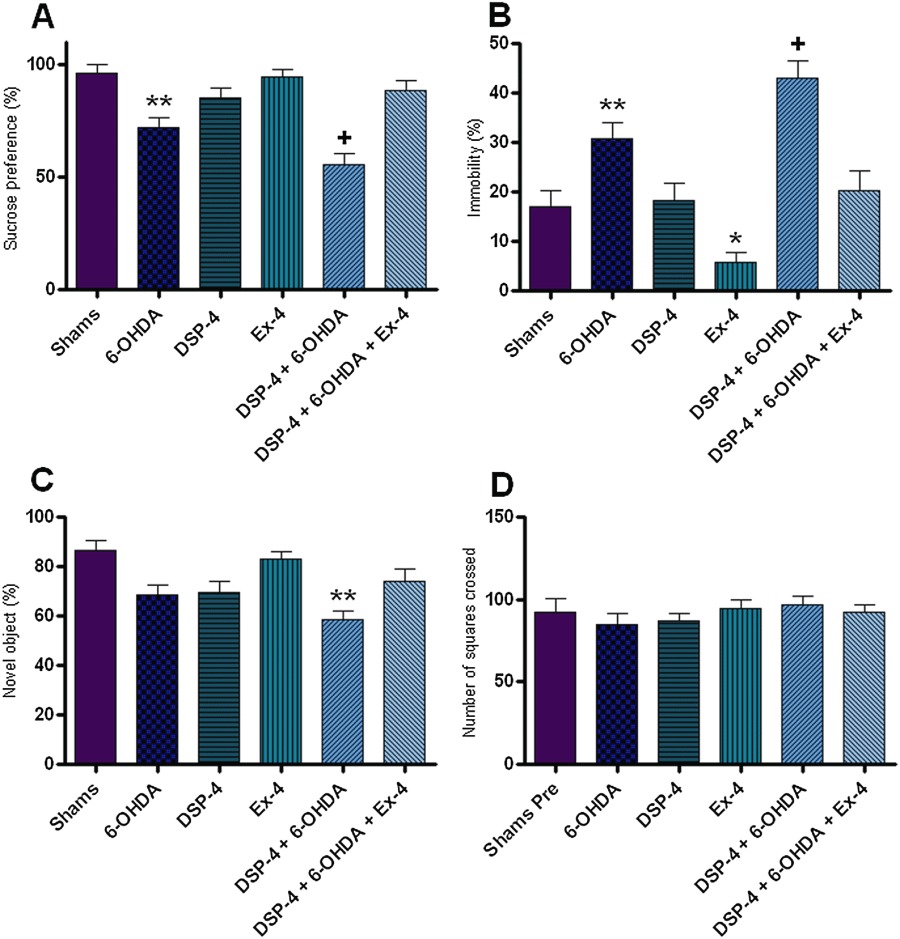
Behavioural assessments. This figure illustrates the various behavioural paradigms utilized in this study. (A) Sucrose preference test, expressed as preference percentage. (B) Forced swim test, measured as percentage of time spent immobile. (C) Novel object recognition, shown as percentage of time exploring the novel object. (D) Open field test, depicted as number of squares crossed. All results were analysed using one-way anova and a post hoc Bonferroni's test to compare differences between groups (n= 10). *Indicates different from sham, P < 0.05. **Indicates different from sham P < 0.001. +Indicates different from 6-OHDA only, P < 0.05.