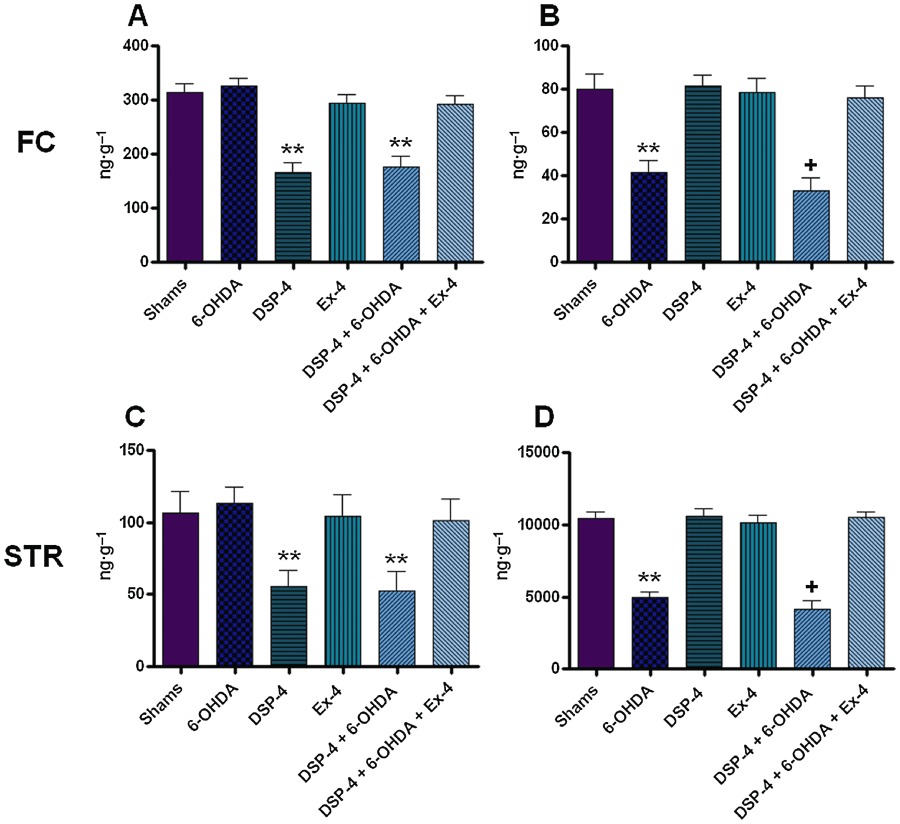
Figure 2.

Noradrenaline (NA) and dopamine (DA) tissue levels in the frontal cortex and striatum. All values are expressed as mean ± SEM denoted in ng·g−1 tissue. All results were analysed using one-way anova and a post hoc Bonferroni's test to compare differences between groups (n= 10). (A) NA in the FC; (B) DA in the FC; (C) NA in the FC; and (D) DA in the STR. **Indicates different from sham P < 0.001; +Indicates different from 6-OHDA only, P < 0.05. FC, frontal cortex; STR, striatum.
