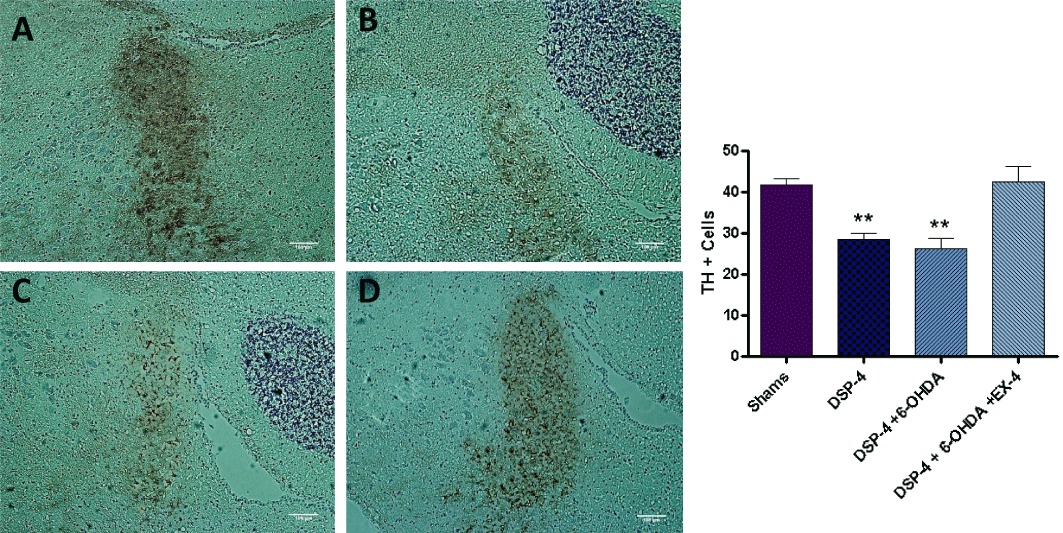
Figure 4.

TH immunostaining in the locus coeruleus – each slice is 12 µm in thickness and the scale bar represents a length of 100 µm. Noradrenergic cell bodies appear dark brown in colour visualized using DAB staining. (A) Shams; (B) DSP-4; (C) DSP-4 + 6-OHDA; and (D) DSP-4 + 6-OHDA + EX-4. Bar graph on the right-hand side shows TH+ cell counts. ** Indicates P < 0.001 compared with sham value. Cell counts were an average of stained neuronal bodies across three adjacent tissue sections.
