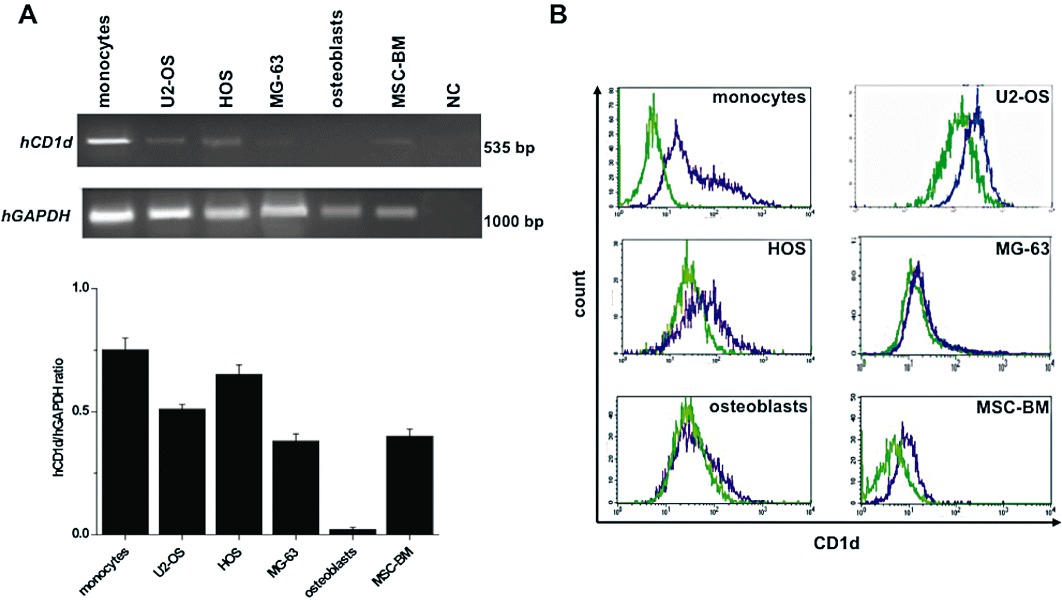
Figure 2.

CD1d expression in human OS cell lines and primary non-malignant cells. (A) CD1d expression was quantified by RT-PCR in: human OS cells (U2-OS, HOS, MG-63), MSC-BM, osteoblasts and monocytes (CD1d+ control). The mRNA was extracted, reverse-transcribed into its related cDNA, and PCR was carried out to amplify CD1d cDNA by using specific primers (see Table 1). Expression of GAPDH was used as a loading control. PCR products were visualized with ethidium bromide on a 2% agarose gel. In the negative control (NC) reverse transcriptase was omitted. The signals are densitometrically analysed; data, calculated as mean ± SEM of at least three determinations, are expressed as the ratio (CD1d/GAPDH) of the signal obtained for each sample divided by that obtained for GAPDH in the same sample to permit between-sample comparison. (B) CD1d surface expression was examined in cells by indirect immunofluorescence using anti-CD1d mAb and FITC-anti-mouse IgG. Data are presented as overlapping histograms: isotype control, green dotted histograms; CD1d, violet histograms. Data represent one of at least three independent experiments.
