
Figure 5.
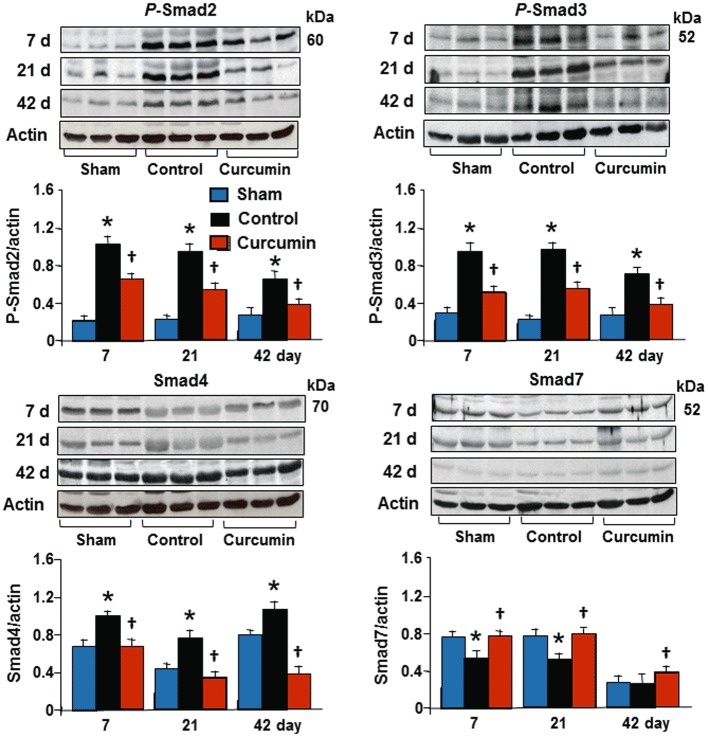
Expression of Smads protein. No significant changes in the total levels of Smad2 and Smad3 were detected (data not shown). However, relative to the sham and non-infarcted zone, ischaemia/reperfusion induced a significant increase in levels of phospho-Smad2, Smad3 and Smad4, and a significant reduction in Smad7 during the course of the experiment in the control group. Curcumin treatment significantly attenuated changes in these proteins as assessed by reduced intensity of bands; shown at the bottom of each panel. All bands were normalized to actin as illustrated at 42 days. n= 8, values are mean ± SEM. *P < 0.05 versus sham; †P < 0.05 versus control.