Figure 1.
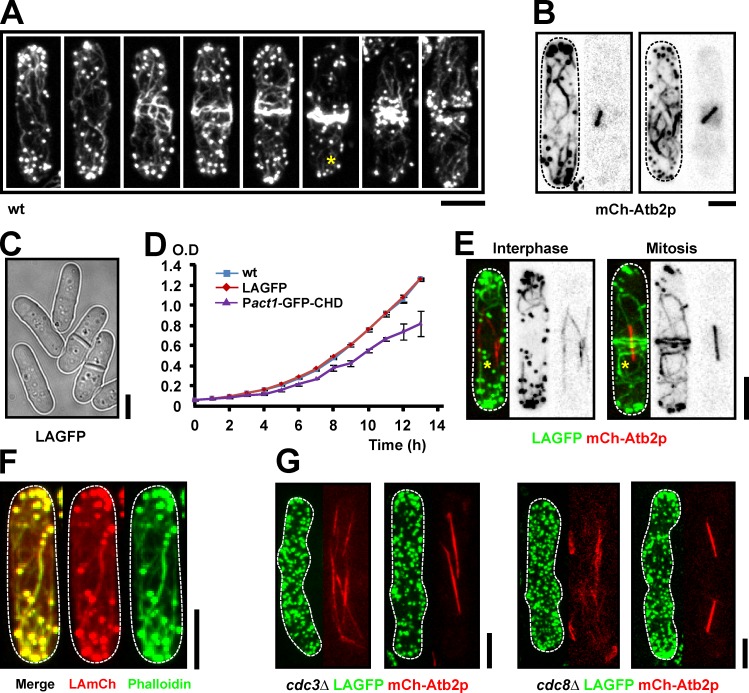
LA is a reliable tool to visualize F-actin in living fission yeast cells. (A) wt cells were fixed with paraformaldehyde and stained with Alexa Fluor 488 phalloidin. The asterisk shows a short cable located at the end of a mitotic cell. (B) Cells carrying mCh-Atb2p were stained as in A. (C) Bright-field image of LAGFP cells. (D) Growth curves of wt, LAGFP, and Pact1-GFP-CHD cells grown in YES at 30°C. Error bars show means ± SD of three independent experiments. (E) LAGFP mCh-Atb2p cells in interphase and mitosis. Asterisks indicate actin cables. (F) LAmCh cells were stained as in A. (G) Images of interphase and mitotic cells of cdc3Δ LAGFP mCh-Atb2p and cdc8Δ LAGFP mCh-Atb2p germinated from spores. Dashed lines indicate the cell boundary. Bars, 5 µm.

