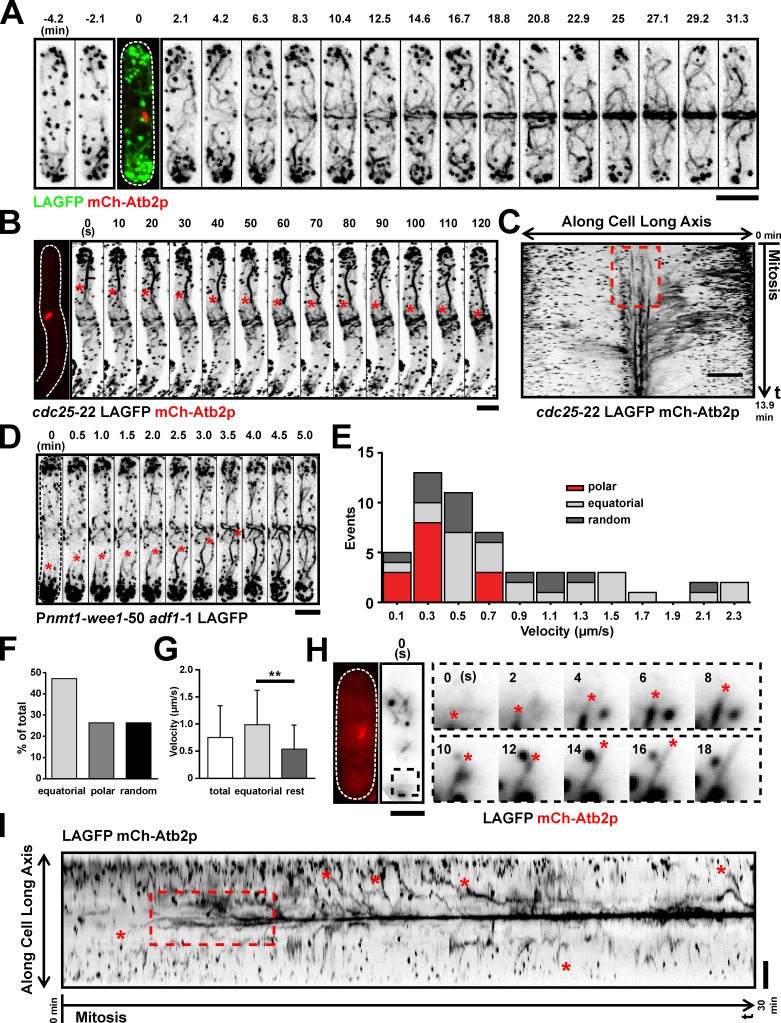
Figure 2.
Nonmedially assembled actin cables migrate toward the middle during ring formation. (A) Time-lapse images of a LAGFP mCh-Atb2p cell. The third image (time 0 min) is shown as a merged image to indicate the cell cycle stage. Video 1. (B) Time-lapse images of a cdc25-22 LAGFP mCh-Atb2p cell after release from 36 to 24°C. The first micrograph on the left was taken before the video was started. Asterisks show a nonmedially assembled actin cable migrating to the medial region during ring assembly. Time interval of this video was 5 s. Video 2 (left cell). (C) Kymograph of ring assembly in a cdc25-22 LAGFP mCh-Atb2p cell revealing a flow of actin fluorescence signal to the cell middle. The broken box illustrates de novo nucleation of actin filaments at the division site. Numbers indicate the duration of the video. (D) Time-lapse images of a mitotic nmt1-wee1-50 adf1-1 LAGFP cell at 36°C. Asterisks show a cable migrating from the nonmedial region to the cell middle. Video 3 (left cell). (E) Stacked histogram showing distributions of cable extension velocities for polar, equatorial, and randomly oriented cables in mitotic LAGFP mCh-Atb2p cells. 59 cables were counted from one single experiment. (F) Graph showing the fraction of cables extending toward the cell middle (equatorial), cell poles (polar), or in other directions (random) in mitotic cells expressing LAGFP and mCh-Atb2p. 59 cables were counted from one single experiment. (G) Graph showing extension rates of cables grouped by their orientations. Error bars show means ± SD. Left to right, n = 59, 28, and 31 cables; **, P < 0.01. Data were counted from TIRFM videos in E, F, and G. (H) TIRFM images showing typical extension of an actin cable in a mitotic cell expressing LAGFP and mCh-Atb2p. The images on the left indicate the mitotic spindle and cable at the start of the video. The montage shows an extending equatorial cable (end marked with asterisks) from the black dashed box. (I) Kymograph of LAGFP signal in a wt cell passing through mitosis (Video 4). Asterisks indicate nonmedial actin cables that migrate to the middle during ring assembly. The broken box illustrates de novo nucleation of actin filaments at the division site. Numbers indicate the duration of the video. Time interval of this video was 2 s. Dashed lines indicate the cell boundary. Bars, 5 µm.

