Figure 4.
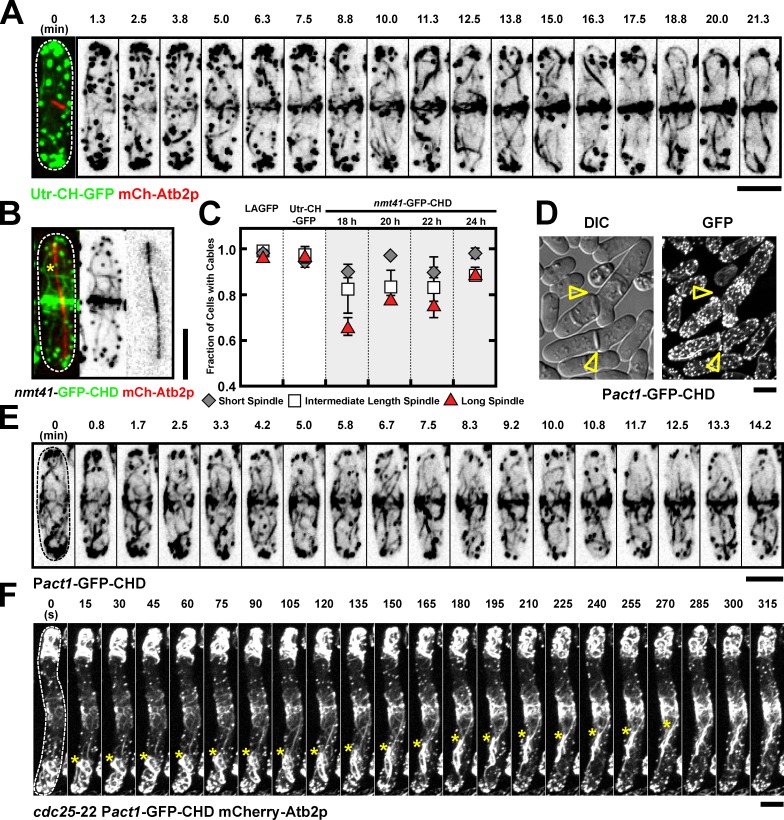
Incorporation of actin cables into the actomyosin ring can also be observed by using Utr-CH and Pact1-GFP-CHD. (A) Time-lapse images of a Utr-CH-GFP mCh-Atb2p cell. Time 0 (cell with short spindle) is shown as a merged image to indicate the cell cycle stage. Video 5 (left cell). (B) Images of an nmt41-GFP-CHD mCh-Atb2p after 20-h induction. Asterisks show cables in the nonmedial region. (C) Graph showing percentage of cells with cables in LAGFP, Utr-CH-GFP, and nmt41-GFP-CHD (18-, 20-, 22-, and 24-h induction). mCh-Atb2p was used in all these cells to measure spindle length. Cells with spindles were grouped into three categories: short, intermediate, and long spindles. Error bars show means ± SD of two independent experiments (n > 30 cells/experiment). (D) Images of Pact1-GFP-CHD cells cultured in YES. Arrowheads identify cells with septation defects. (E) Time-lapse images of a Pact1-GFP-CHD cell. Video 5 (right cells). (F) Time-lapse images of a cdc25-22 Pact1-GFP-CHD mCh-Atb2p cell after release from 36 to 24°C. Asterisks show cables migrating toward the middle. Video 6 (left cell). DIC, differential interference contrast. Dashed lines indicate the cell boundary. Bars, 5 µm.

