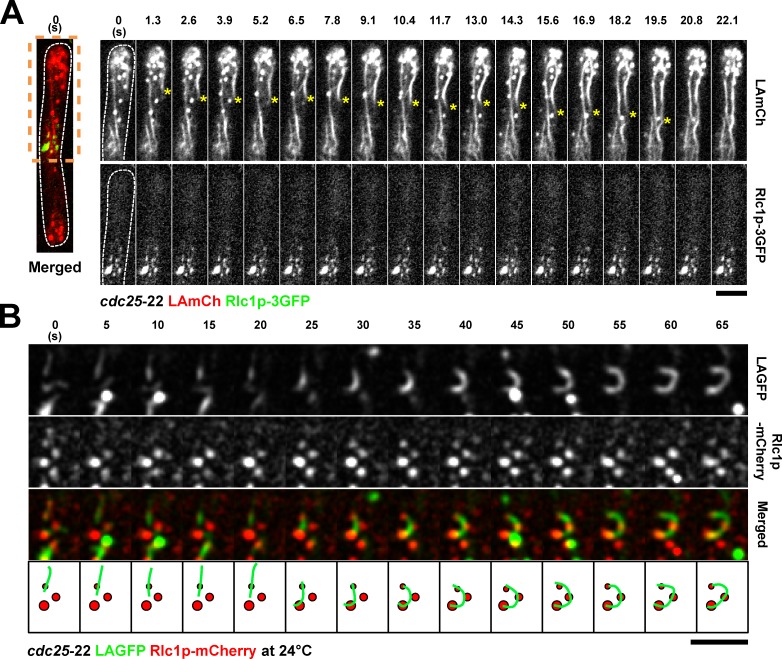
Figure 5.
Double-color imaging of nodes and LA-labeled actin cables. (A) Spinning-disk single-plane images of a cdc25-22 LAmCh Rlc1p-3GFP cell after release from 36 to 24°C. Image on the left is shown as a merged image to indicate the spatial relationship between nodes and nonmedial actin cables. Time-lapse images of the region of the cell within the orange dashed box are shown on the right. Time interval is 1.3 s. Asterisks show the migration of a nonmedial cable toward the middle. Video 7. (B) TIRFM time-lapse double-color images of a cdc25-22 LAGFP Rlc1p-mCh cell at 24°C, showing an actin cable that was captured and bent by three static Rlc1p nodes. The bottom is a schematic representation of the merged montage. Green, actin cable; red, cortical nodes. Dashed lines indicate the cell boundary. Bars, 5 µm.

