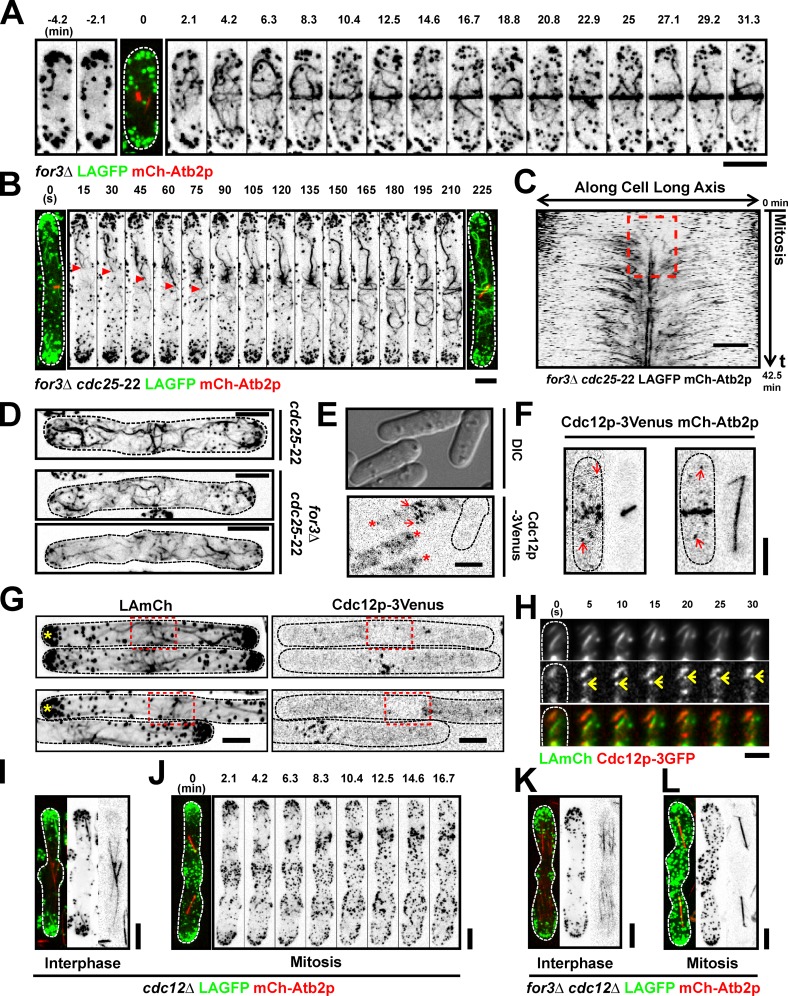
Figure 6.
Nonmedially assembled actin cables are nucleated by forminlike protein Cdc12p. (A) Time-lapse images of a for3Δ LAGFP mCh-Atb2p cell. The third panel (time 0 with short spindle) is shown as a merged image to indicate the cell cycle stage. Video 8 (left cell). (B) Time-lapse images of a for3Δ cdc25-22 LAGFP mCh-Atb2p cell after release from 36 to 24°C. Arrowheads point to an actin cable migrating to the cell middle during ring assembly. Video 8 (right cell). (C) Kymograph of a for3Δ cdc25-22 LAGFP mCh-Atb2p cell after release from 36 to 24°C, revealing a flow of F-actin signals from the nonmedial region to the cell middle. The broken box illustrates de novo nucleation of actin filaments at the division site. Numbers indicate duration of the video. Time interval, 15 s. (D) cdc25-22 and for3Δ cdc25-22 cells were fixed with paraformaldehyde and stained with Alexa Fluor 488 phalloidin. (E) Cdc12p-3Venus nodes (arrows) and speckles (asterisks) could be clearly distinguished from the background at 515 nm. Cdc12p-3Venus LAmCh cells and wt cells were grown in YES at 24°C and mixed before imaging. Dashed line shows the boundary of the wt cell. (F) Images of two mitotic Cdc12p-3Venus mCh-Atb2p cells. Arrows show nonmedially located Cdc12p-3Venus speckles during mitosis. (G) Maximum intensity projected images of cdc25-22 LAmCh Cdc12p-3Venus cells after release from 36 to 24°C. Asterisks point out the cells with medial accumulation of actin cables but without accumulation of Cdc12p-3Venus nodes. Red broken boxes show the medial region of the indicated cells. (H) TIRFM time-lapse double-color images of a LAmCh Cdc12p-3GFP cell, showing a Cdc12p-3GFP speckle moving rapidly along a LAmCh-labeled actin cable. Arrows point to the Cdc12p-3GFP speckle. (I) Image of an interphase cdc12Δ LAGFP mCh-Atb2p cell germinated from spore. (J) Time-lapse images of a mitotic cdc12Δ LAGFP mCh-Atb2p cell germinated from spore. Video 9 (left cell). (K and L) Images of interphase and mitotic for3Δ cdc12Δ LAGFP mCh-Atb2p cells germinated from spores. Video 9 (right cell). DIC, differential interference contrast. Dashed lines indicate the cell boundary. Bars, 5 µm.

