Figure 8.
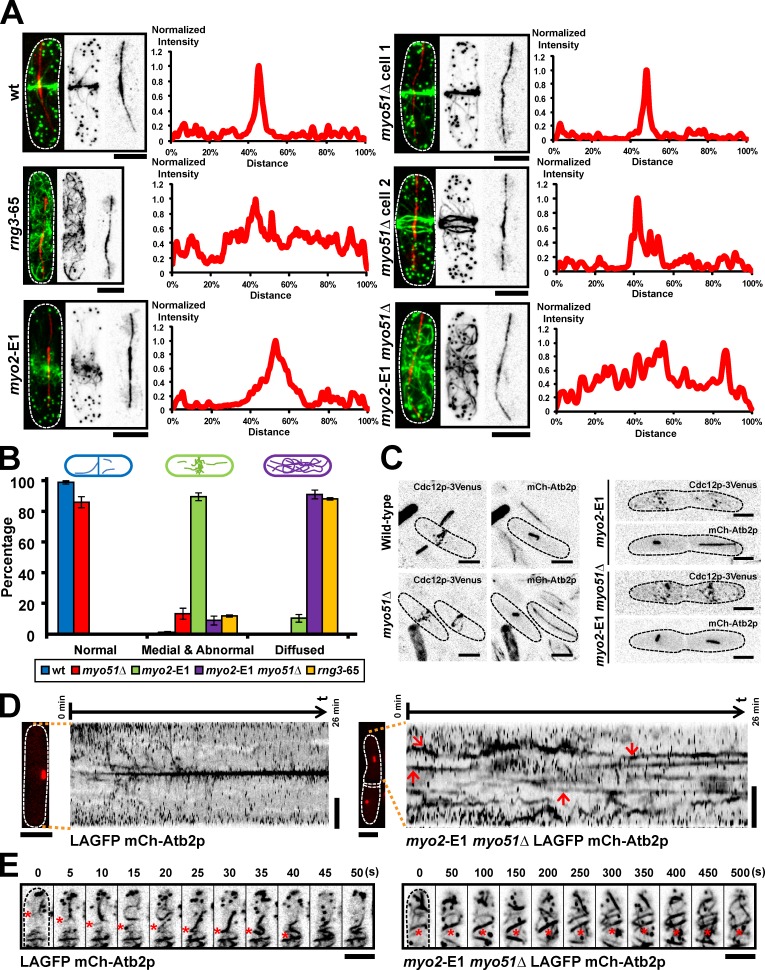
Myo2p and Myo51p participate in actin cable reorganization during actomyosin ring assembly. (A) Cells of indicated genotype (without any fluorescent marker) were treated with HU for 4 h at 24°C and then shifted to 36°C for 2.5 h. HU was washed out, and cells continued to grow at 36°C for an additional 2 h. Cells were fixed and stained with Alexa Fluor 488 phalloidin and the TAT1 antibody to visualize F-actin and tubulin, respectively. Fluorescence intensities of F-actin in various mutants were measured along the cell length. The data shown are from a single representative experiment out of more than three repeats (n ≥ 10 cells/experiment). (B) Quantitation of different F-actin localization patterns in various mutants. Error bars show means ± SD of three independent experiments (n = 100 cells/experiment). Cells were grouped into three categories based on the actin patterns. Normal: cells with normal sharp actin ring. Medial and abnormal: cells with actin cables concentrated at the medial region of the cell but not properly compacted into a ring. Diffused: cells with actin cables scattered throughout the cell. (C) Images of wt, myo2-E1, myo51Δ, and myo2-E1 myo51Δ cells expressing both Cdc12p-3Venus and mCh-Atb2p. All cells were shifted to 36°C for 4 h before imaging. (D) Kymographs of LAGFP mCh-Atb2p and myo2-E1 myo51Δ LAGFP mCh-Atb2p cells. Spinning-disk single-plane images were taken every 5 s. Maximum intensity projected mCh-Atb2p images on the left of the kymographs were taken just before the start of the videos. Arrows in the kymograph of myo2-E1 myo51Δ LAGFP mCh-Atb2p cell indicate the stable actin structures observed in mitosis. Numbers on top of each kymograph indicate the start time and end time of the video. Video 10. (E) Stable actin structures were observed in myo2-E1 myo51Δ LAGFP mCh-Atb2p cells. Cell culturing and imaging conditions were the same as in D. Asterisks in the left montage show the migration of an actin cable to the middle in LAGFP mCh-Atb2p cell. Asterisks in the right montage show the stable actin structures in myo2-E1 myo51Δ LAGFP mCh-Atb2p cell. Video 10. Dashed lines indicate the cell boundary. Bars, 5 µm.

