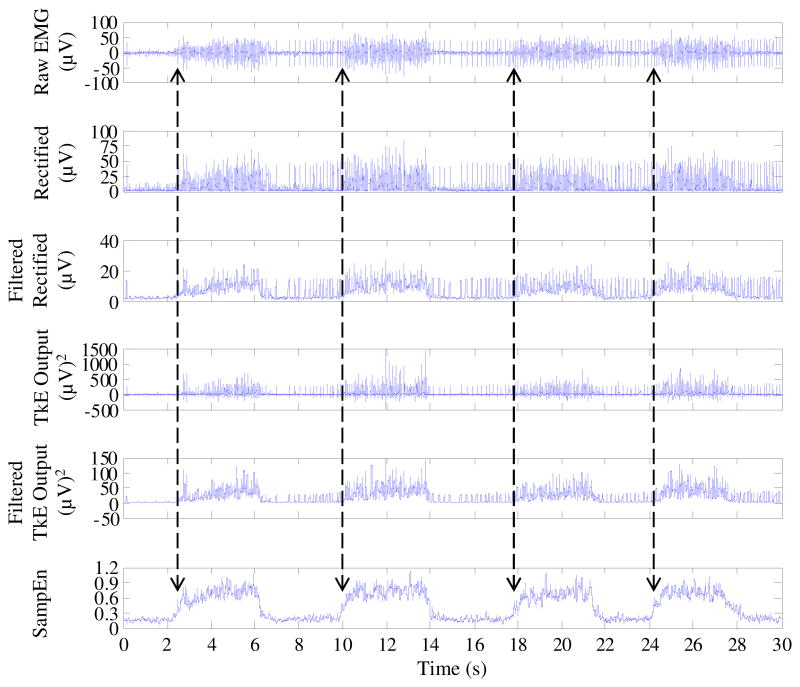
Fig. 4.
An example of the real surface EMG signal contaminated by a series of tonic spikes and its corresponding rectified time series, TKE outputs (with absence or presence of a 32 ms sliding window), and SampEn values (with global tolerance) used for onset detection. Each of the detected onset time from the SampEn analysis was marked by a vertical arrow.

