
Figure 2.
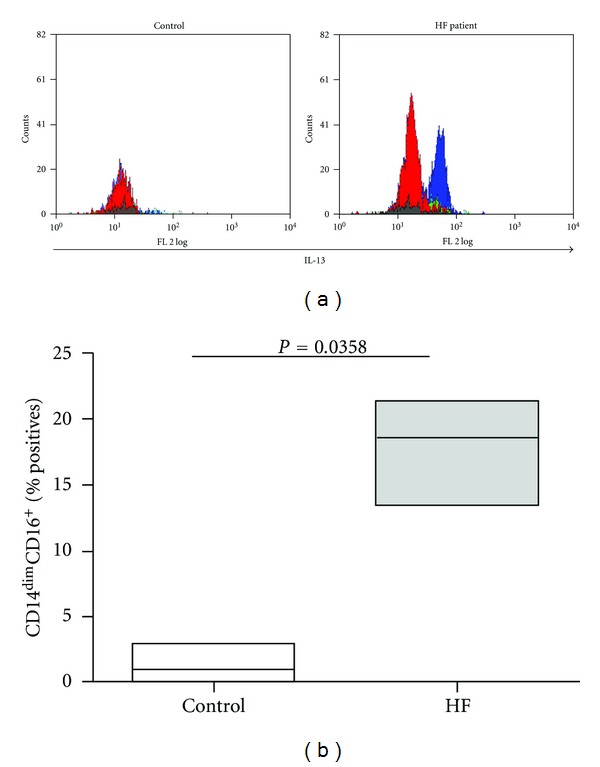
Production of IL-13 by each of the monocyte subsets. (a) Representative flow cytometry histograms of IL-13 producing monocyte subsets in a healthy control and an HF patient. Each of the three monocytes subsets was gated as described in Figure 1, and their respective ability to express IL-13 was evaluated by intracellular staining for the cytokine (n = 5). Grey histogram, isotype control for IL-13; red histogram, the CD14++CD16− classical subset; green histogram, the CD14+CD16+ subset; blue histogram, the CD14dimCD16+ nonclassical subset. (b) Their percentage (median values) from the CD14dimCD16+ monocytes was determined.