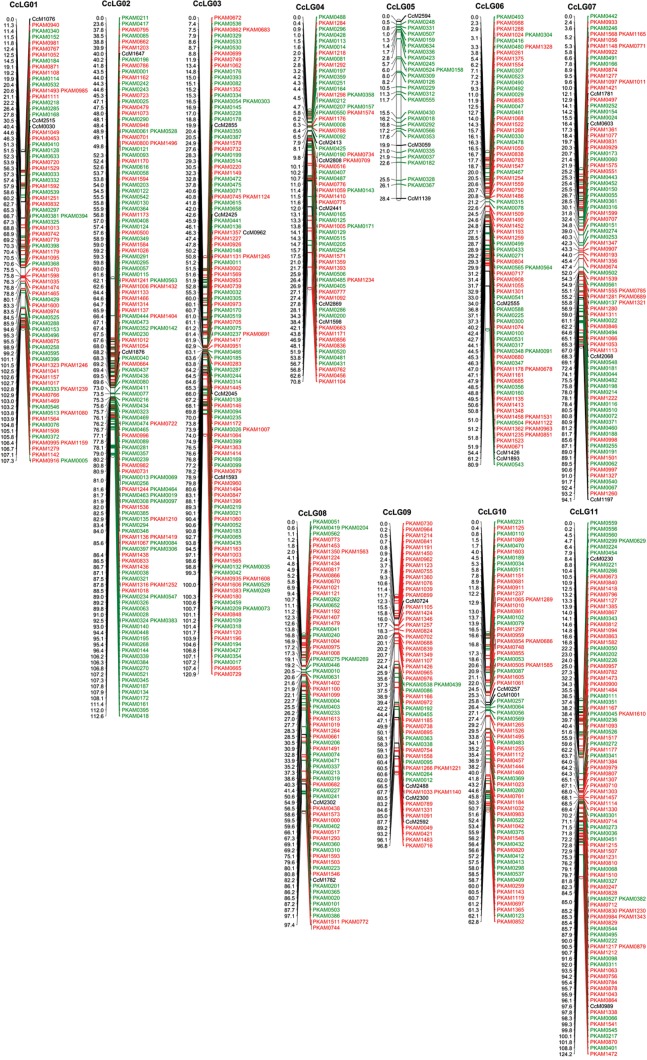
Figure 1.
An integrated genetic map of pigeonpea. This genetic map is developed on the F2 mapping population derived from ICP 28 × ICPW 94. The map comprises 910 loci (875 PKAMs and 35 SSRs) in which 444 PKAMs were developed based on GAIIx-SNPs, shown in red; 431 PKAMs were developed based on TOGs-SNPs, shown in green, and 35 SSRs previously mapped by Bohra et al.9 shown in black.

