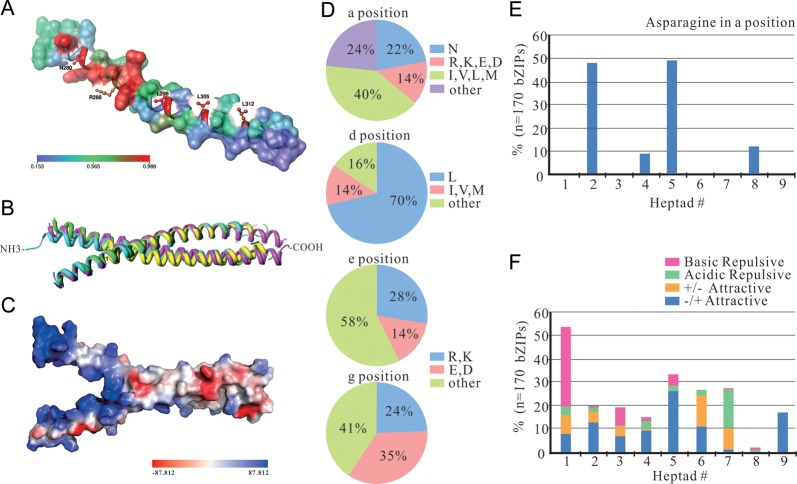
Figure 2.
The three-dimensional structure analysis and the prediction of dimerization properties of 170 ZmbZIP proteins. (A) Mapping of surface conservation of ZmbZIP14 based on the rest of the 169 ZmbZIP proteins. Conserved sites and regions are labelled and represented in the red sphere, whereas regions lacking conservation are in blue. (B) The superposition structure of bZIP domains of ATF-2 (PDB ID: 1T2K, pink), CREB (PDB ID: 1DH3, green), GCN4 (PDB ID: 1YSA, blue) and HY5 (PDB ID: 2OQQ, yellow). (C) The electrostatic potential map of CREB. The red sphere represents negative potential, whereas the blue sphere represents positive potential. (D) Pie charts depicting the frequency of the amino acids at the a, d, e and g positions of the Leu zippers of all ZmbZIP proteins. (E) Histogram of the frequency of Asn residues present at the a position of the Leu zippers for all ZmbZIP proteins. (F) Histogram of the frequency of attractive or repulsive g↔e’ pairs per heptad for all ZmbZIP proteins.

