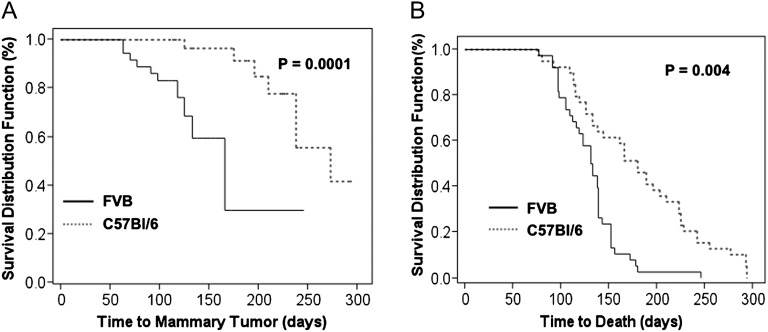
Fig. 2.
Mammary tumor development and survival rates in FVB and C57Bl/6 control mice. (A) Time to mammary tumor formation following DMBA exposure in control FVB (solid line) and C57Bl/6 mice (dotted line). Represents the percent of mice that develop mammary tumors over time. (B) Time to death of control FVB (solid line) and C57Bl/6 mice (dotted line) from all causes.

