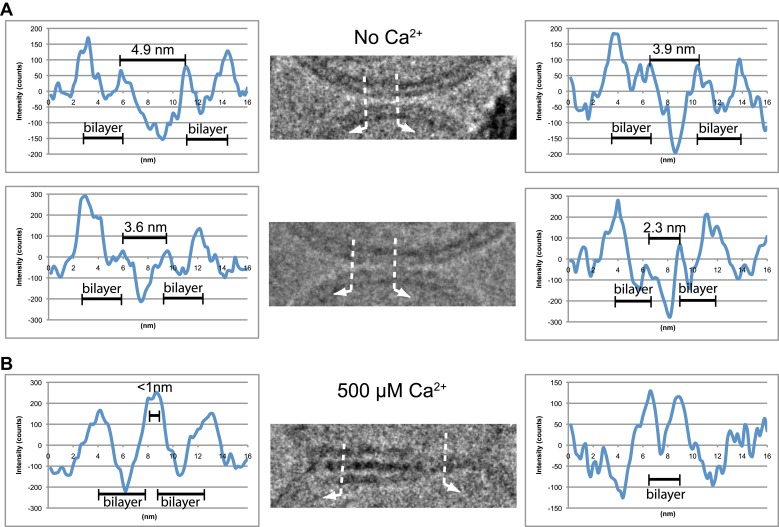
Figure 3.
Image density profile analysis of selected vesicle–vesicle interfaces. (A) Image density profile analysis of two representative point contacts between vesicles at zero Ca2+. Dotted lines indicate 2 nm thick sections selected from the cryo-EM images. These sections were used to generate the profiles shown to the left and the right of the close-up views in the center (for details, see ‘Materials and methods’). (B) Image density profile analysis of a transition from extended close contact to hemifusion diaphragm after addition of 500 μM Ca2+. As in panel A, selected sections are indicated by dotted lines, and the corresponding profiles are shown the left and right of the close-up view in the center.

