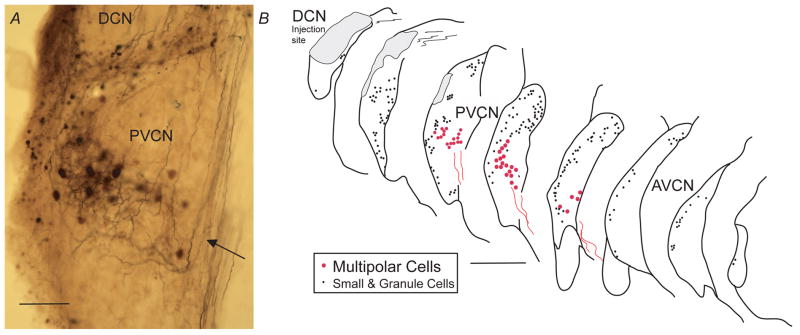
Figure 3.
A. Light micrograph showing the pattern of multipolar-cell labeling in a band (arrow) in the PVCN. Labeled processes are mainly branches of auditory nerve fibers. Smaller cells and granule cells are labeled at the lateral margin (left side of micrograph) and in the lamina dividing the PVCN from the DCN. Scale bar = 100 μm. B. Atlas drawings showing positions of multipolar cell (red circles) and small and granule cells (black dots). Labeled multipolar cell axons (red lines) project out of the nucleus in a ventromedial direction. Each panel of the atlas shows the labeled neurons in single 80-μm sections with half (every other one) of the sections omitted for clarity. Scale bar = 500 μm.

