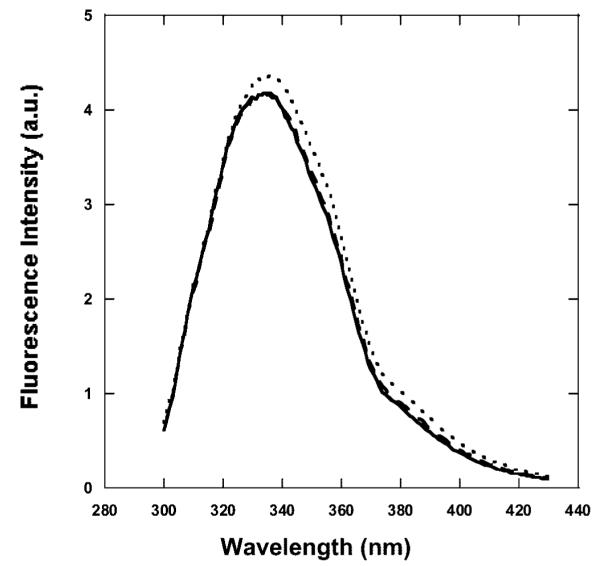
Figure 5.

Emission spectra of BLG at pH 9 (λex ) 280 nm). The spectra are representative emission spectra of BLG/PPIX complexes at pH 8 and above for the initial nonirradiated complex (solid line), the final nonirradiated complex (dashed line), and the final (23 J/cm2) irradiated complex (dotted line). The emission of BLG in the irradiated complex increases and shifts to longer wavelengths.
