Figure 6.
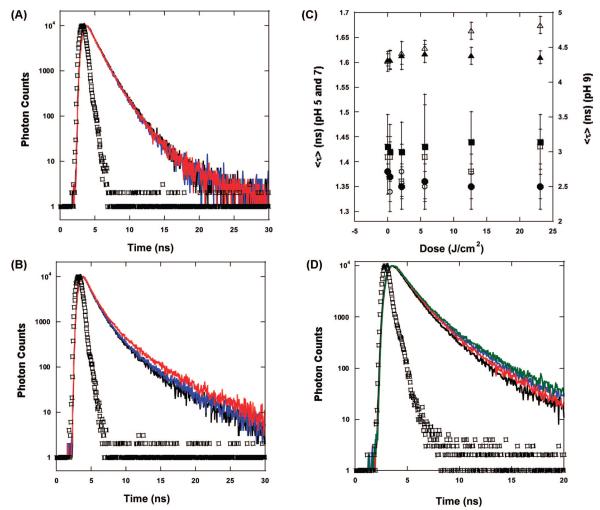
Fluorescence decay of BLG in the BLG/PPIX complexes (λex = 280 nm and λem = 330 ± 4 nm). (A) pH 6. The decay of the complex before irradiation (black), the final nonirradiated complex (blue), and the complex irradiated with 23 J/cm2 (red) are basically superimposed. (B) pH 9. The decay of the complex after irradiation with 23 J/cm2 (red) is clearly longer lived than the decay of the complex before irradiation (blue) and the nonirradiated complex (black). (C) The values of ⟨τ⟩ calculated from eq 3 show that at pH 7 and below, the decay of BLG in the complex does not change when comparing irradiated samples [(○) pH 5 and (□) pH 7] and non irradiated samples that were left in the dark for the same amount of time as that required for irradiation [(●) pH 5 and (■) pH 7]. At pH 8 and above ⟨τ⟩, the irradiated complex (Δ) increases with the dose compared to the nonirradiated samples (▲). (Note: the error bars for the data at pH 7 and below appear larger because of the difference between the left-hand side scale and the right-hand side scale of the plot). (D) Comparison of the BLG decay in air and under N2 saturation. The decay of the irradiated sample in air (blue) is longer than the decay of the nonirradiated sample in air (black). The decay of the nonirradiated sample under N2 (red) is slower than the corresponding one in air. After irradiation (green), the decay lengthens even further. In A, B, and D, the prompt is represented by □.

