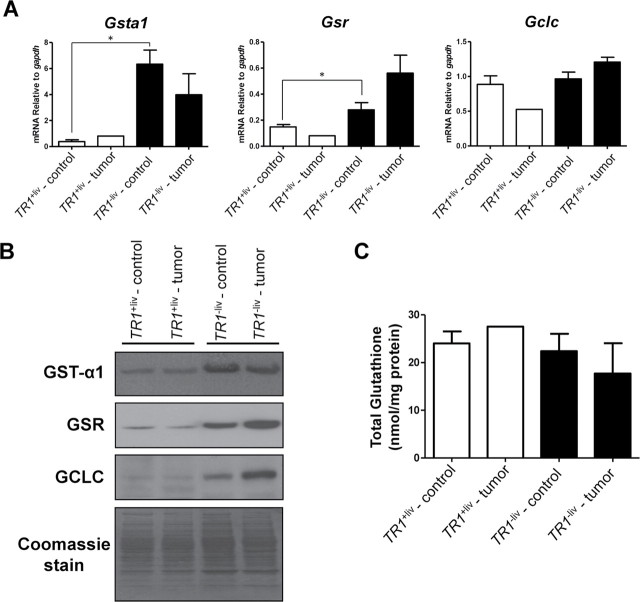
Fig. 3.
Expression of enzymes involved in GSH metabolism and GSH levels in TR1 +liv and TR1 −liv mice. (A) mRNA levels of Gsta1, Gsr and Gclc. Gene expression was analyzed by real-time PCR. Data are shown as relative mRNA levels compared with GAPDH (n = 1 for TR1 +liv tumor, n = 4 for other samples; *Denotes statistical difference, P ≤ 0.05). (B) Western blot analysis of GST-α1, GSR and GCLC. Protein extracts were prepared from tumors and surrounding control tissue from livers of TR1 +liv and TR1 −liv mice. Representative samples from a western blot are shown. Coomassie blue staining is shown in the bottom panel as control for protein loading. (C) Total GSH levels were measured in livers from TR1 +liv control (n = 3), TR1 +liv tumor (n = 1), TR1 −liv control (n = 3) and TR1 −liv tumor (n = 3) tissues.

