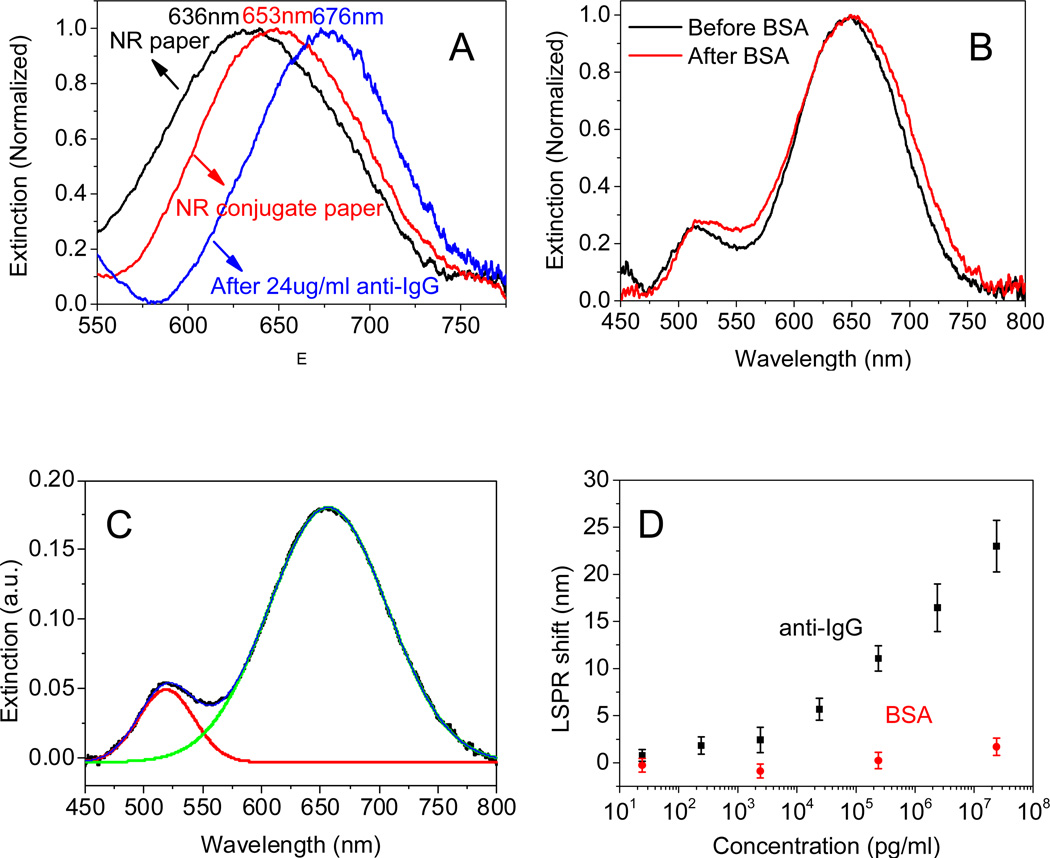
Figure 4.
(A) Extinction spectra of AuNR paper substrate (black), AuNR-IgG conjugates on the paper substrate before (red) and after binding of anti-IgG (blue). (B) Control experiment showing the small non-specific binding of BSA on bioplasmonic paper substrate. (C) LSPR spectra deconvoluted using two Gaussian peaks. (D) Plot showing the LSPR peak shift of bioplasmonic paper for various concentrations of anti-IgG and BSA.

