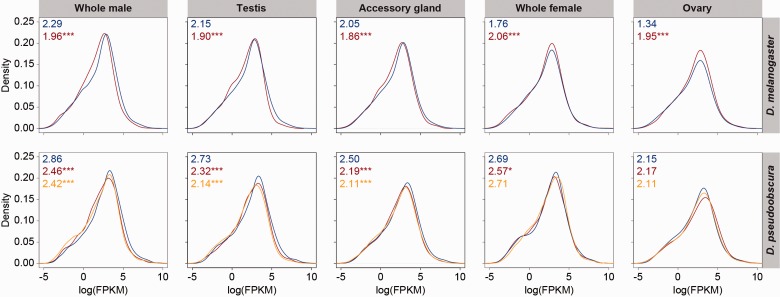
Fig. 3.—
Absolute expression on X chromosomes and autosomes in different tissues. Density plots of absolute expression for X chromosomes and autosomes in different tissue of D. melanogaster (top) and D. pseudoobscura (bottom). Each panel corresponds to a different tissue, with autosomal densities depicted in blue, ancestral X chromosome (D. melanogaster X and D. pseudoobscura XL) densities depicted in red, and D. pseudoobscura XR densities depicted in orange. Medians are given in the top left corner of each panel, with asterisks corresponding to P < 0.05 (*), P < 0.01 (**), and P < 0.001 (***).

