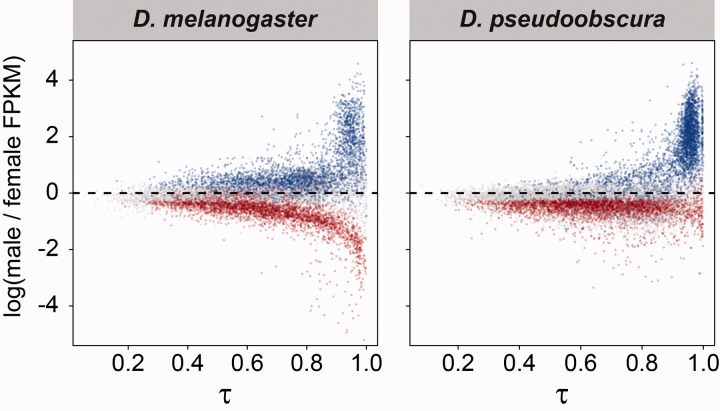
Fig. 8.—
Tissue specificity of sex-biased genes. Correlations between whole male/whole female expression ratios and τ in D. melanogaster (left) and D. pseudoobscura (right). Unbiased genes are represented by gray dots, male-biased genes by blue dots, and female-biased genes by red dots (n = 2). Horizontal dashed lines indicate equal male and female expression.

