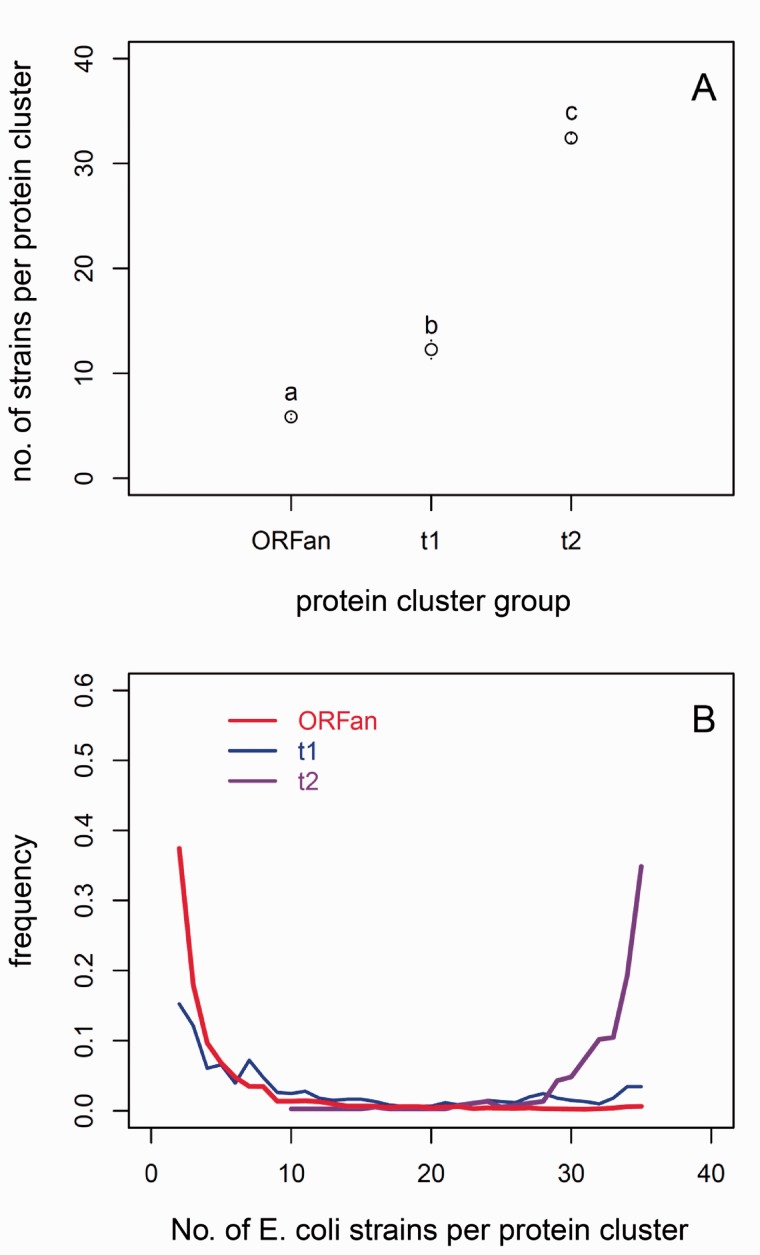
Fig. 5.—
Distribution of ORFan and non-ORFan genes among genomes of Escherichia coli strains. (A) The average number of E. coli stains per protein cluster in the ORFan and non-ORFan cluster groups; (B) the frequency distribution of number of E. coli stains per cluster used in the ORFan and non-ORFan comparison groups (this excludes ORFan clusters with only one member, which is the most common size of a cluster). ORFans typically have narrow distributions, while non-ORFans in the t2 comparison group are present in most genomes. Non-ORFans in the t1 group have an intermediate distribution. The letters in (A) denote significantly different results by the Wilcoxon test (results from Student’s t-test are the same).

