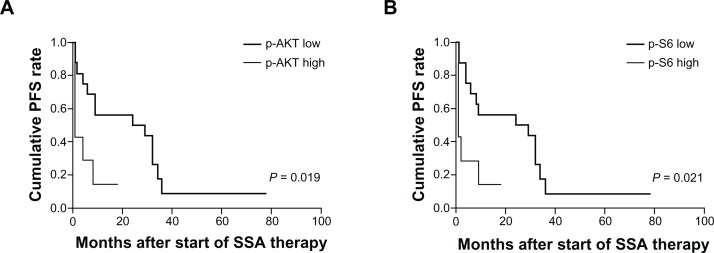
Figure 2.
Kaplan–Meier progression-free survival curves for patients undergoing treatment with SSAs according to p-AKT (A) and p-S6 (B) expression scores.
Notes: Low p-AKT and p-S6 corresponds to absent/weak staining score; high p-AKT and p-S6 corresponds to moderate/strong staining score. P-values were calculated using a log-rank test.
Abbreviation: SSAs, somatostatin analogs.

