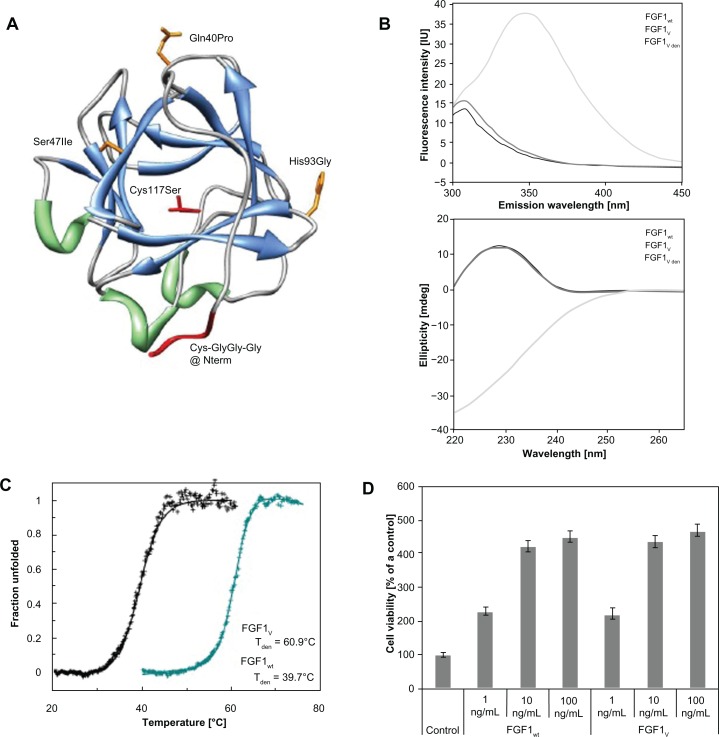
Figure 1.
FGF1 variant dedicated for specific conjugation with gold nanoparticles. (A) The spatial structure of FGF1 with the introduced mutations (based on PDB: 2Q9X). Side chains of mutated residues involved in stability effects are represented in orange; mutations designed to facilitate thiol-mediated conjugation are marked in red. (B) Fluorescence (upper panel) and circular dichromism (lower panel) spectra of native wild-type FGF1, native FGF1V, and denaturated FGF1V at a protein concentration of 2 × 10⁻⁶ M in 25 mM sodium phosphate buffer, pH 7.3. (C) Normalized thermal denaturation curves of FGF1 wild-type (in black) and engineered FGF1V variant (in blue). Changes in ellipticity were monitored at 228 nm wavelength, in the presence of 0.7 M GdmCl in 25 mM sodium phosphate buffer, pH 7.3, and at a protein concentration of 2 × 10⁻⁶ M. (D) Proliferative activity of FGF1V and wild-type FGF1 measured by the MTT assay.
Notes: Starved NIH 3T3 cells were incubated with the growth factor for 48 hours in the presence of 10 U/mL heparin. Equal volume of PBS was added to the control samples. Results shown are mean values from four experiments. Bars indicate +/− standard deviation.
Abbreviations: FGF1, fibroblast growth factor 1; PDB, Protein Data Bank; FGF1V, fibroblast growth factor 1 variant; MTT, 3-(4,5-dimethylthiazol-2-yl)-2,5-diphenyltetrazolium bromide; NIH 3T3, mouse embryonic fibroblast cell line; PBS, phosphate buffered saline.

