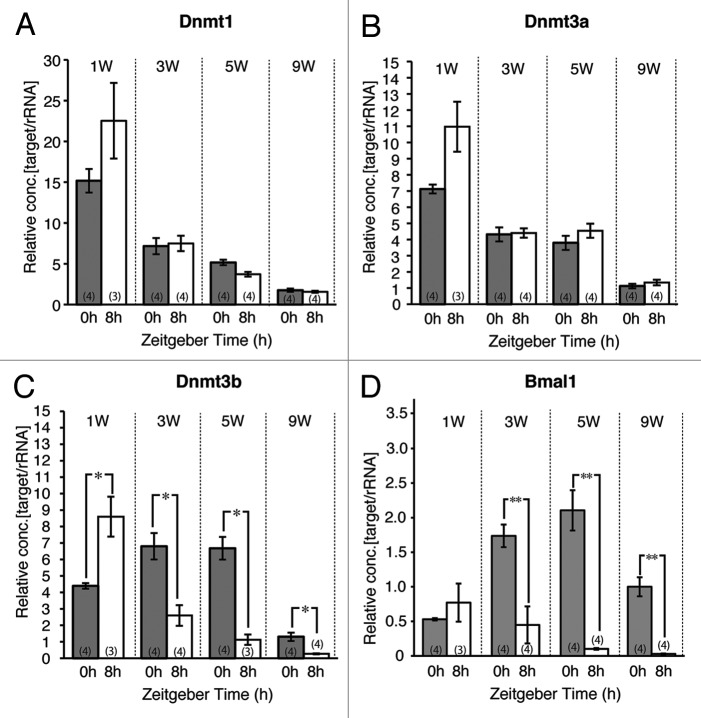
Figure 2.Dnmts and Bmal1 mRNA expression at ZT 0 and 8 in the liver during postnatal development. There were no significant differences between ZT 0 and 8 through postnatal development in mRNA expressions of Dnmt1 (A) and Dnmt3a (B). Significant decrease of Dnmt3b mRNA in postnatal 3, 5, and 9 weeks at ZT 8 vs. ZT 0, although significant increase was found in postnatal 1 week (C). Significant increase of Bmal1 mRNA in postnatal 3, 5, and 9 weeks at ZT 8 vs. ZT 0 (D). The expression level in ZT 0 at postnatal 9 weeks was set as 1 and relative concentrations are shown. Numbers used in each group is shown in parentheses. *p < 0.05, **p < 0.01 (Student’s t-test).

An official website of the United States government
Here's how you know
Official websites use .gov
A
.gov website belongs to an official
government organization in the United States.
Secure .gov websites use HTTPS
A lock (
) or https:// means you've safely
connected to the .gov website. Share sensitive
information only on official, secure websites.
