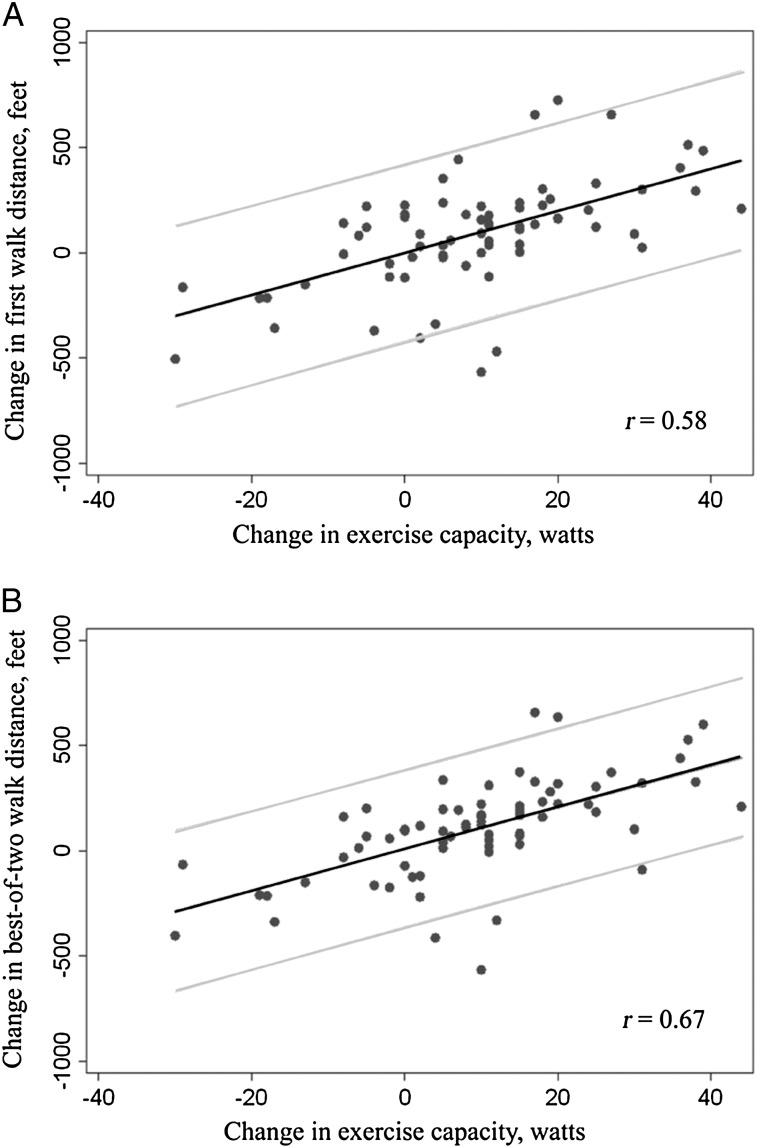
Figure 2.
A, B, Scatterplots for change in walk distance vs change in exercise capacity measured on cardiopulmonary exercise testing in patients undergoing lung volume reduction surgery (n = 74). Each plot has a fitted regression line with 95% confidence bands. The scatter was closer to the line, the 95% confidence bands were narrower, and the correlation (r) was stronger for best-of-two walk distances compared with change in the first walk distance. The increase in the correlation was significant for the best-of-two-walk distances vs that for the first walk distance (r = 0.58 vs r = 0.67, respectively, P = .04).

