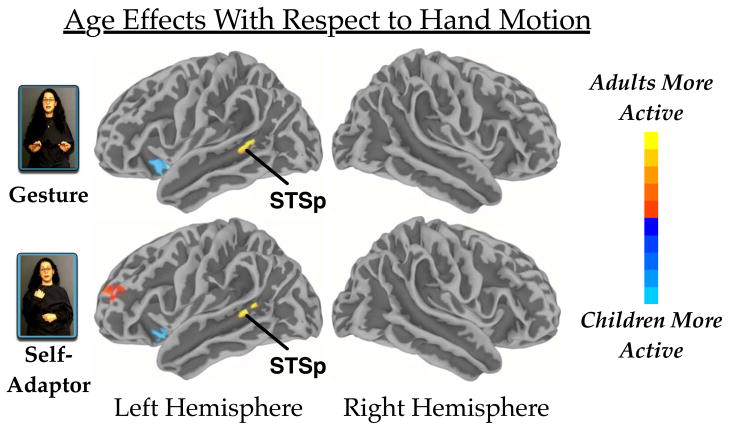
Figure 3.
Main effects of age group reported for both conditions for the analysis of the whole-brain. Colors in the red spectrum indicate greater activity for adults. Colors in the blue spectrum indicate greater activity for children. The figure identifies activation differences in the upper bank of the posterior superior temporal sulcus (STSp). The individual per-vertex threshold was p < .01 (corrected FWE p < .05).

