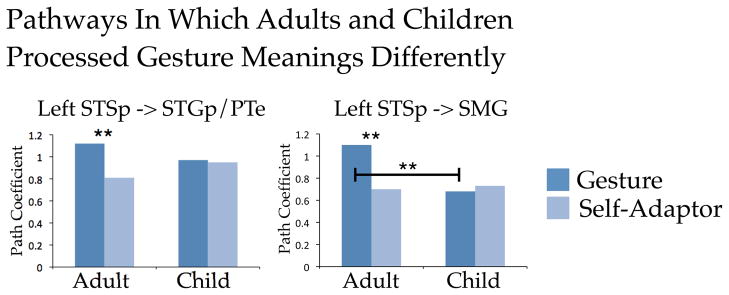
Figure 5.
Results of the structural equation modeling analysis for the seven pathways of interest. Path coefficients for each pathway were statistically assessed for the age group by condition interaction. Significant interactions were found for the pathways left STS -> SMG and left STSp -> STGp/PTe. SMG = Supramarginal gyrus; STGp/PTe = Posterior superior temporal gyrus and planum temporale; STSp = Posterior superior temporal sulcus. * p < .05. ** p < .01.

