Fig. 5.
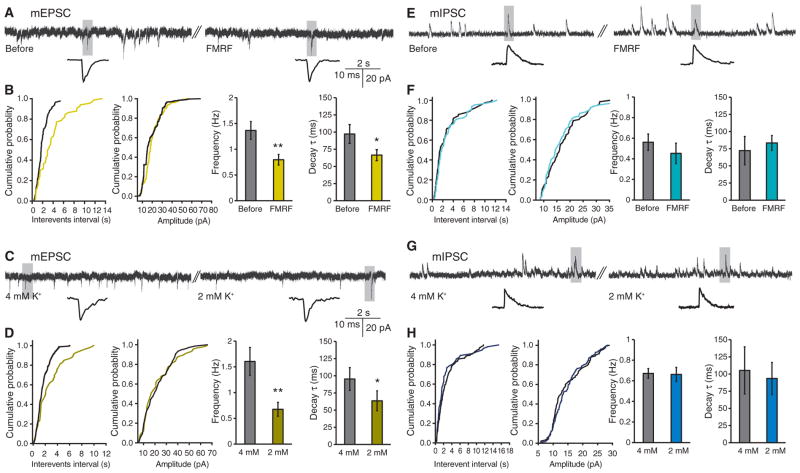
Astrocytic Ca2+ signaling decreases mEPSC frequency but not mIPSC frequency in hippocampal slices. (A) Representative recordings of mEPSCs before and after superfusion of FMRF (15 μM) in slices prepared from MrgA1+/− mice. (B) Cumulative analysis of the inter-event interval and amplitude of mEPSCs in a 1-min representative recording before and during application of FMRF. Bar graphs compare frequency and time constant of decay (τ). n = 9 slices. *P < 0.05; **P < 0.01 compared to before FMRF treatment, paired t test. (C) Representative recordings of mEPSCs when bath K+ concentration was decreased from 4 to 2 mM; shaded area is shown below at extended time scale. (D) Cumulative analyses of the inter-event interval and amplitude of mEPSCs. Bar graphs compare frequency and decay τ of mEPSCs. n = 8 slices. *P < 0.05; **P < 0.01 compared to 4 mM K+, paired t test. (E) Representative recordings of mIPSCs before and after perfusion of FMRF in slices prepared from MrgA1+/− mice. (F) Cumulative analyses of the inter-event interval and amplitude of mIPSCs from representative traces. Comparison of the effect of FMRF on frequency and decay τ (n = 7 slices, paired t test). (G) Representative recordings of mIPSCs when bath K+ concentration was decreased from 4 to 2 mM. (H) Cumulative analyses of the inter-event interval and amplitude of mIPSCs. Histograms compare frequency and decay τ of mIPSCs (n = 7 slices, paired t test).

