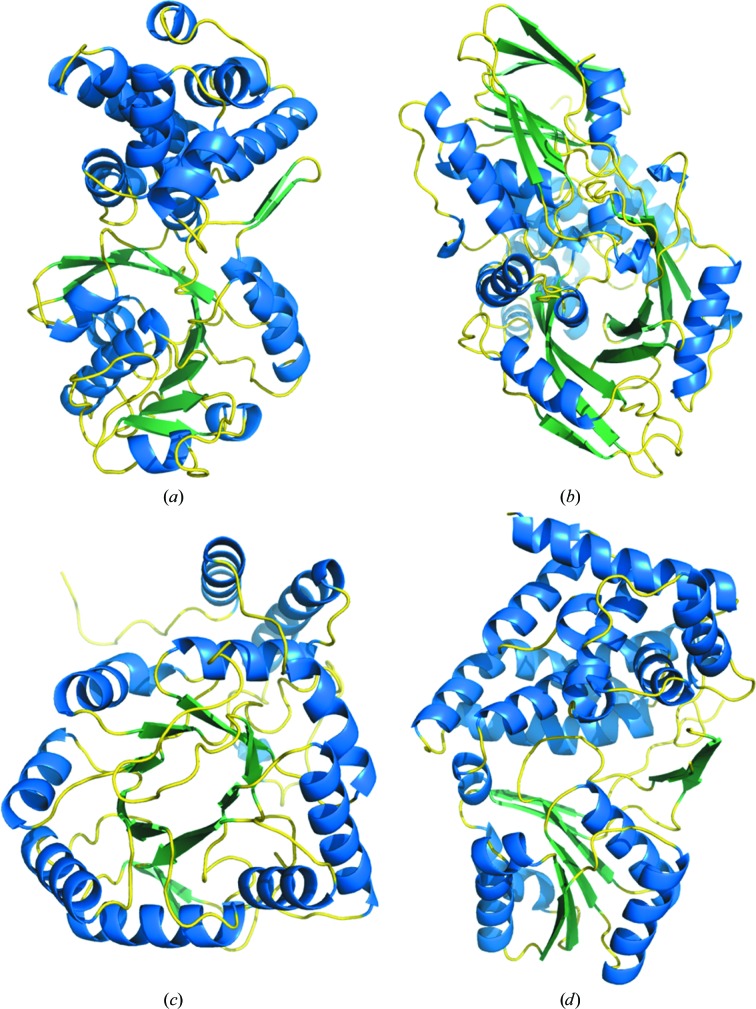
Figure 3.
Comparison of monomer structures of representatives of each of the five families of glycerol (phosphate) dehydrogenases. (a) S. cerevisiae GPD1 (PDB entry 4fgw) represents the cytosolic G3PDHs. (b) E. coli GlpD (PDB entry 2qcu) represents the membrane-bound G3PDHs. (c) G. oxydans AKR11B4 (PDB entry 3n2t) represents GDHs resembling aldo-keto reductases. (d) B. stearothermophilus GDH (PDB entry 1jpu) represents GDHs from the polyol dehydrogenase family and also the G1PDHs. The classic Rossmann fold is positioned at the bottom in (a). The high β-sheet content in GlpD is evident at the top and bottom of (b). Modified Rossmann folds are evident in the core of AKR11B4 in (c) and at the bottom of GDH in (d).

