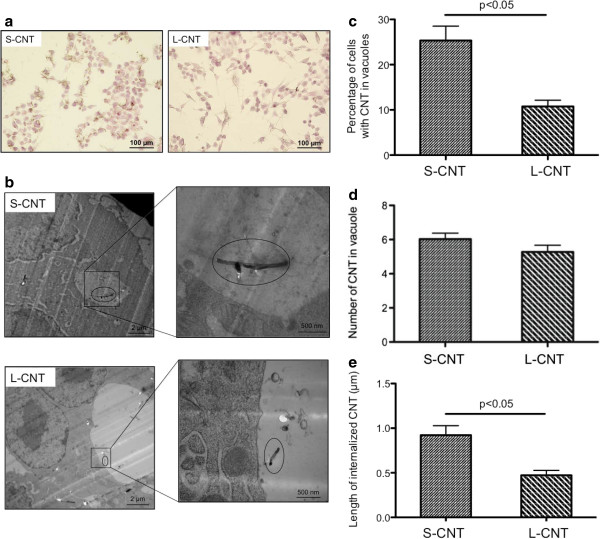
Figure 5.
Microscopy images of macrophages exposed to S- and L-CNT. Optical microscopy (panel a) and TEM (panel b) images of RAW 264.7 macrophages exposed to 10 μg/mL of S- and L-CNT for 24 hours. Quantification of the percentage of cells with CNT-containing vesicles (panel c). Quantification of the number of CNT inside vesicles (panel d). Quantification of CNT length inside vesicles (panel e). Data are represented as mean ± SEM. P<0.05 between S- and L-CNT.

