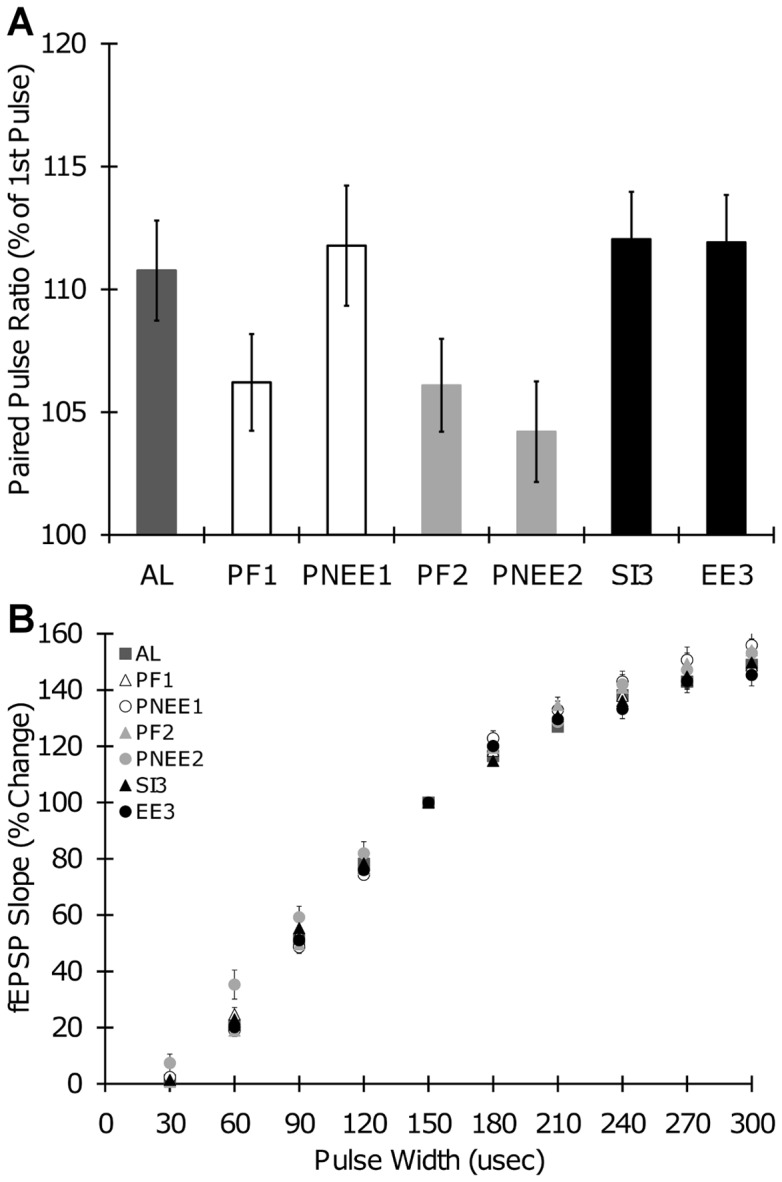
Figure 2. Input/Output Curves and Paired Pulse Ratios.

(A) Paired pulse (PP) ratios with a 50 ms inter-stimulus-interval. (B) Input/output (I/O) curves showing fEPSP slope plotted against stimulus strength for all developmental treatment groups. Baseline synaptic strength increased with increased stimulation in all slices. AL, ad labium; PNEE1, prenatal ethanol exposure 1; PNEE2, prenatal ethanol exposure 2; EE3, ethanol exposure 3; PF1, pair-fed 1; PF2, pair-fed 2; SI3, sham intubated 3.
