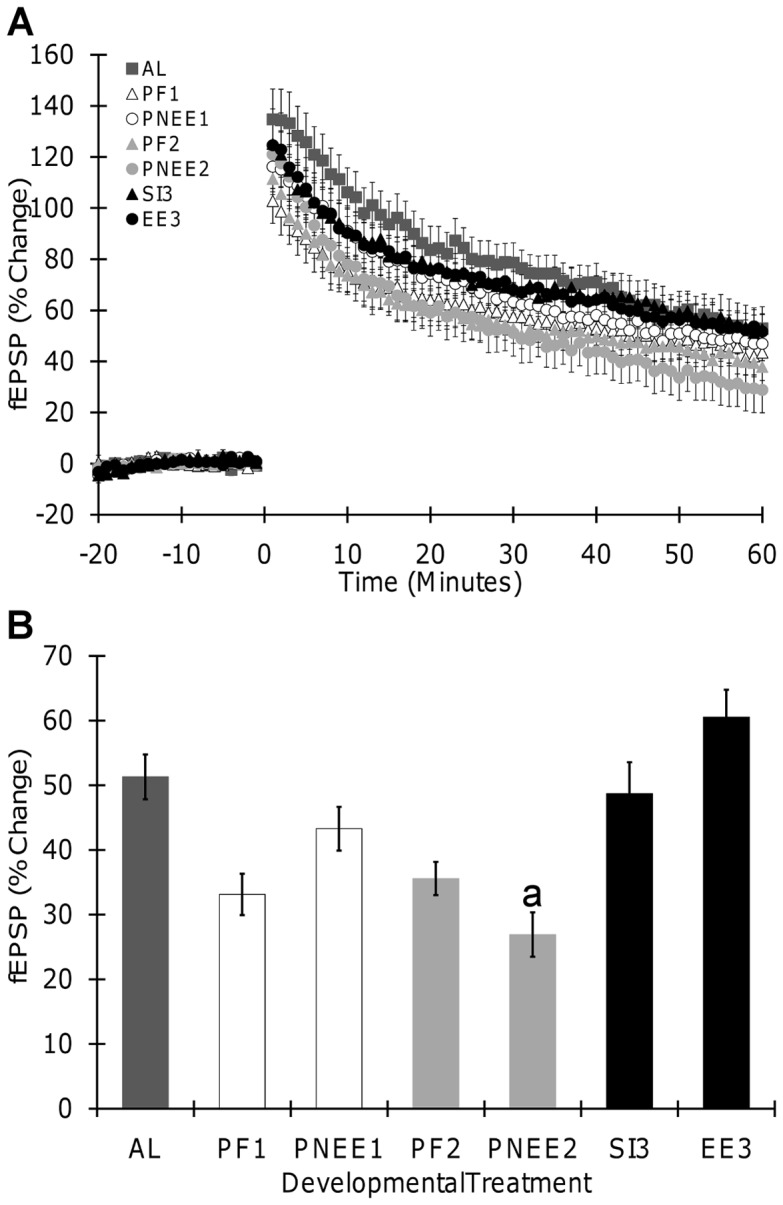
Figure 4. Long term-potentiation induced by high frequency stimulation in hippocampal slices.

(A) Field excitatory postsynaptic potential (fEPSP, slope) recorded before and after HFS in slices from all treatment groups. (B) Effects of developmental ethanol exposure on LTP. No significant main effect of sex was obtained, thus data from male and female offspring were pooled together. Each point and bar graph shown is the mean ± SEM. Insert illustrates samples of traces obtained from corresponding groups; fEPSP recorded before (gray) or 1 hour (black) after conditioning stimulation are superimposed. Scale bar represents 0.5 mV by 10 ms. a, significantly different from AL. AL, ad libitum; PNEE1, prenatal ethanol exposure 1; PNEE2, prenatal ethanol exposure 2; EE3, ethanol exposure 3; PF1, pair-fed 1; PF2, pair-fed 2; SI3, sham intubated 3.
